
System monitoring with Sysinternals
Health Check
The Sysinternal tools are free tools from Microsoft that can help Windows administrators handle many tasks. This article introduces the Sysinternal tools that are useful for system monitoring. All of the tools described here can be downloaded free of charge from the Microsoft site [1], either as individual downloads or as part of the Sysinternals suite.
One advantage of the Sysinternals utilities is that you don't need to install them, so they can be launched conveniently from a USB stick. When launched for the first time, the programs display a license dialog; you can suppress this dialog with the /accepteula option, which can be useful in scripting. Unfortunately, this option does not work for all of the Sysinternal tools.
The programs only run on a Windows system as of Windows 2000 Server. For this article, I used Windows Server 2008 R2 and Windows 7. Windows Server 2008 R2, Windows Server 2008, Windows Vista, and Windows 7 do not support access to the hidden System $ shares such as C$, or admin$ as easily as Windows XP or Windows Server 2003; the computers do not belong to a Windows domain because the new operating systems block access to administrative shares by authentication of local user accounts.
Some Sysinternal tools, such as PSInfo.exe, require access to the admin share and thus will not work at first. To allow access, you must enable local logins to administrative shares in the Registry of standalone computers. To do so, launch the Registry Editor by typing regedit, then navigate to HKEY_LOCAL_MACHINE\SOFTWARE\Microsoft\Windows\CurrentVersion\Policies\System. Create a new Dword entry with the label LocalAccountTokenFilterPolicy, set the value to 1, then restart the computer.
LDAP Microscope
Insight for Active Directory, also known as AdInsight, lets you monitor the LDAP connections on a domain controller in real time with a GUI. The user interface is similar to the Sysinternal tools Regmon and Filemon. The tool investigates calls to the wldap32.dll file, which most programs, including Exchange, use for LDAP-based access to Active Directory per LDAP.
AdInsight lists all requests including those that are blocked. This gives administrators an easy option for analyzing authentication problems with Active Directory-aware programs and identifying clients and servers that set up a connection to the domain controller. AdInsight logs all requests issued to domain controllers and stores them as an HTML report or text file for troubleshooting purposes. The logfile contains the client request and responses that the client received via LDAP.
AdInsight also logs access to system services (Figure 1). When a program such as Exchange accesses the domain controller, the window fills with information; then, you can right-click to display details of the individual entries, as well as filter the display via the menu.
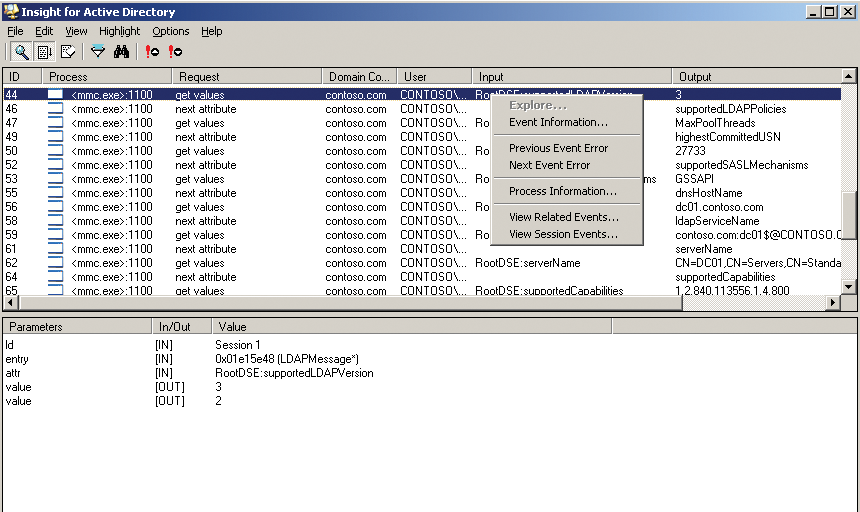
The display also includes the name of the accessing user. Unfortunately, AdInsight only lets you monitor local access; over-the-wire diagnostics via remote access are not supported. However, AdInsight's search function does let you filter by process, error, or request response. The tool selects the response to let you perform specific monitoring.
AdInsight also supports automated deployment and offers a variety of options for this. One useful automation feature is the ability to write the log to a file without displaying the events in the GUI. AdInsight runs on Windows 2000 Server or newer and includes a help file, which can be a useful aid for tasks that require more thorough analysis.
Filesystem, Registry, Processes
The Process Monitor provides a graphical user interface for monitoring and color-tagging the filesystem, registry, and process/thread activity in real time. The tool combines two programs standard to Sysinternals: Filemon and Regmon. With a click of the button, you can enable and disable the individual monitoring options and restrict your monitoring of registry and filesystem access and process calls to an area in which you are interested.
Process Monitor is a valuable aid for monitoring stability and identifying bottlenecks; it is capable of logging all read and write access to the system and its media. Additionally, it displays comprehensive data on any process or thread that is launched or terminated. Also, you can monitor any TCP/IP connections that are opened, as well as UDP traffic. Note that Process Monitor does not save the content of the TCP packets or payload data; it is not specifically designed for network monitoring. If that is what you need, you might prefer a tool such as Wireshark [2].
The Process Monitor tool is also extremely useful for troubleshooting local connection and privilege problems (Figure 2). If needed, it can display additional information on active processes (e.g., their DLL files or the parameters set when the process was launched).
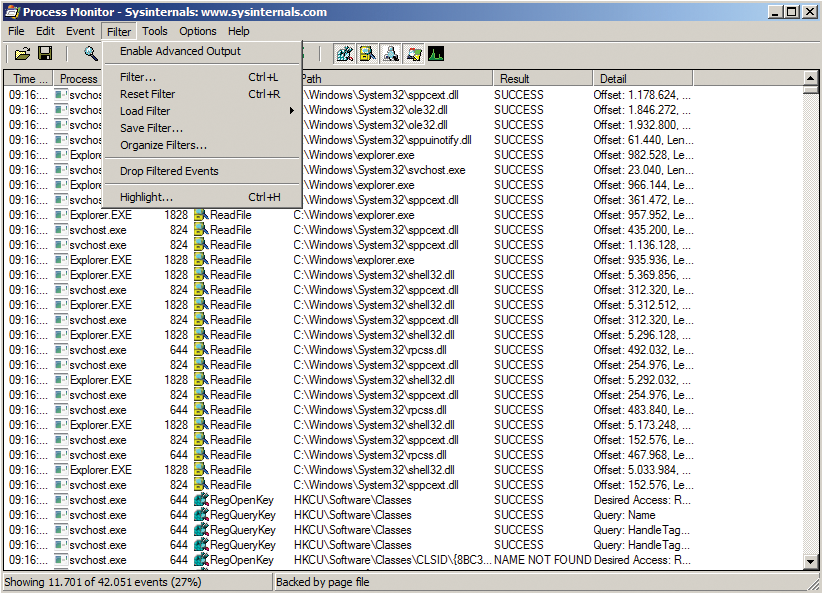
The filter function allows you to reduce the volume of data output generated by Process Monitor. For example, it lets you hide any processes with a specific string in their names, without filtering out registry entries that contain the same string. Additionally, you can enable multiple filters at the same time and save the configuration.
For more efficient diagnostics, you might want to save the logfile and then load it for analysis, applying additional filters as needed. The Tools menu gives you a selection of preconfigured views.
Process Monitor can also monitor the boot process on a server because it launches at a very early stage. You can redirect all the output to a file. If Windows fails to boot, analysis of the output file gives you a fast way to identify the issue. Just like all Sysinternal tools, Process Monitor is easy to use and does not have an extended learning curve.
Process Explorer takes things a step further than Process Monitor, in that Process Explorer lists all the processes in a window and includes more detailed information on the current process, such as access to directories (Figure 3).
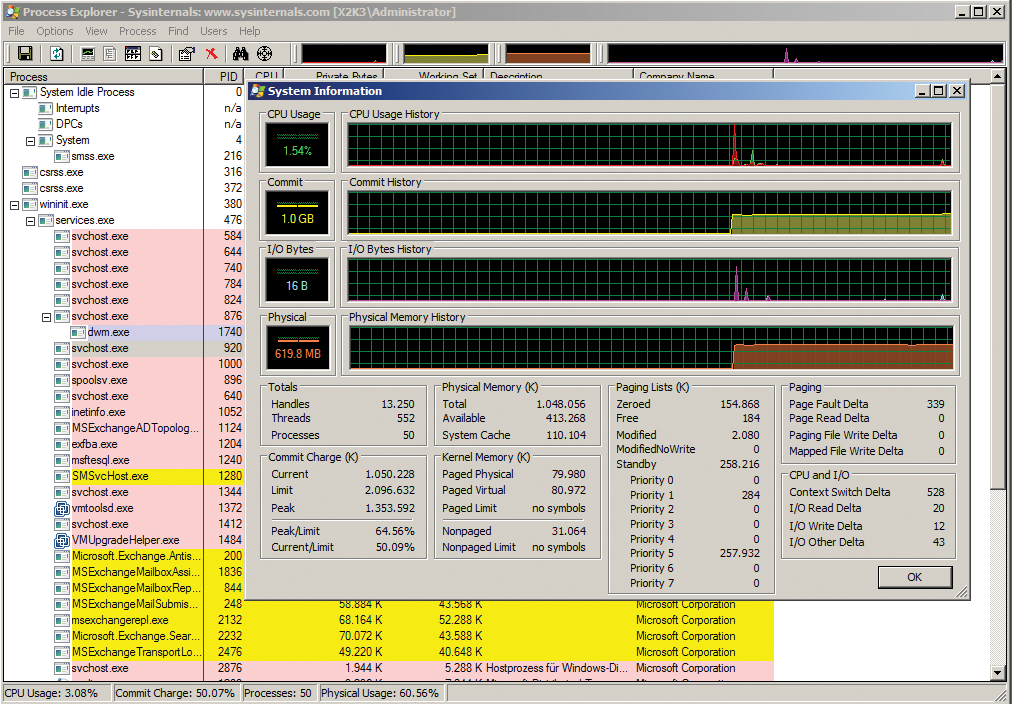
In DLL View mode, the tool shows which libraries are used and where they originated. The process menu contains a Restart entry that first kills a process and then restarts it. Also, you can temporarily stop individual threads and highlight processes in different colors. Process Explorer nests in the taskbar, which provides an at-a-glance overview of the current CPU load and disk utilization.
Logging into the Domain
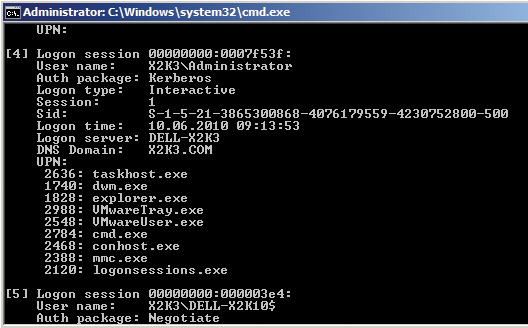
The LogonSessions tool lists all the active sessions on a computer at the command line (Figure 4). If you run this command without setting options, the prompt buffer size might not be sufficient to display all of the information. In this case, you can use the logonsessions | more command or modify the command-line prompt properties to increase the buffer size. Alternatively, you can redirect the output to a file by specifying > logon.txt. The -p option tells LogonSessions to display the active processes in the individual sessions for login users, allowing you to monitor who is logged in to a terminal server and which applications the users are running. The tool is also really useful in Active Directory environments.
Monitoring Local Logins
Just like LogonSessions, PsLoggedOn is a tool for monitoring logged in users. If you type psloggedon at the command-line prompt, the tool will display all the logged in users on the local system with their login times (Figure 5). Also, you can see who is accessing a share on the server. If you launch the tool with the username as an argument, it will investigate all the computers in the network environment or domain and show you where the user is logged in. Unfortunately, this is not an entirely error-free process in Windows DOS. Although you can identify domain users logged in to the local computer, you can't actually find out where else the user is logged on in the domain. If you use psloggedon \\computername, you can also display domain users logged in remotely.
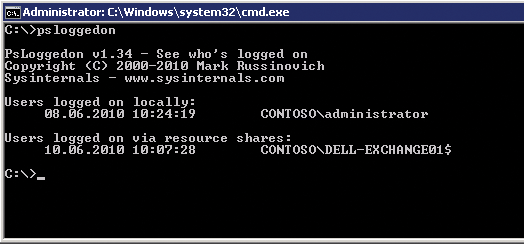
To access a computer on the network, the user account with which you launch PsLoggedOn must have administrative privileges on the remote machine. Although you can check who has an active session on a computer without add-on tools, with net session, for example, you can only monitor local logins, not network logins. The tool accesses the HKEY_USERS registry key for this check (Windows creates a separate key for each logged in user by default).
The -l option lists locally logged in users only; -x leaves out the login times. The PsLoggedOn tool is useful when you need to investigate unauthorized access to your network and see the computers on which a user is logged in.
Psinfo is another tool in the collection that lets you retrieve a variety of information for the local system, such as the operating system, the CPU, the build number, and whether the computer is a member server or a domain controller. Calling psinfo /? lists more options. For example, psinfo -s lists the software packages installed on the machine. Although Microsoft provides programs such as systeminfo.exe and msinfo32.exe with Windows, Psinfo can also retrieve information from remote computers across the wire.
Event Lister
The PsLogList utility is a command-line tool that retrieves the event display from various computers and then displays and compares events. If you run the tool without any options, it will output the entries in the local system event log. The program has numerous options that give you various ways of comparing the event logs that you retrieve.
Table 1 lists some of PsLogList's command-line options. By default, the tool uses the system event log; you can select the event log by entering the first letter or by entering an abbreviation, such as sec for security.
Tabelle 1: Selected PsLogList Options
|
Name |
Function |
|---|---|
|
File |
Runs the command on all the computers listed in the file. Each computer needs a separate column in the text file. |
|
|
Lists the entries after the specified date. |
|
|
Lists entries before the specified date. |
|
|
Deletes the event logs after displaying them in PsLogList, which is useful in the case of batch-controlled retrieval. |
|
|
Displays the entries for the past n days. |
|
|
Filters entries with defined IDs. |
|
|
Filters entries with specific types (e.g., |
|
|
Lists entries for the past n hours. |
|
|
Shows entries with IDs defined in a comma-separated list of IDs. |
|
|
Stores entries for the defined event log. |
|
|
Lists entries for the past n minutes. |
|
|
Only shows the n latest defined entries. |
Monitoring Shares
The ShareEnum tool lets you monitor shares and their security settings by scanning either an IP range or all the PCs and servers in a domain (or all the domains in a network) for shares (Figure 6). To display all of this information reliably, you need to log in as the domain administrator, which is the only account with privileges on all the PCs and servers in the domain. In networks without a domain, you can use the administrator account for the login; however, you need to set the password to be the same on all the computers you want to monitor. ShareEnum shows you not only the shares but also the local paths for the shares on the computer.
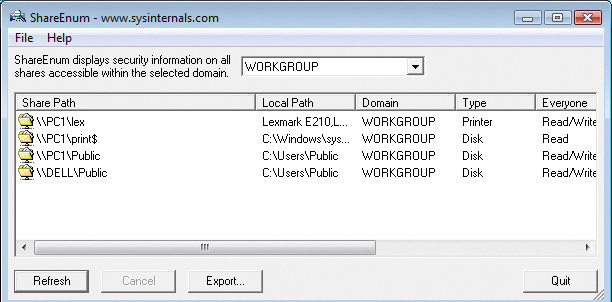
The Refresh button tells ShareEnum to launch a scan. If you want to scan an individual computer, enter the same IP address as the start and end address of the IP range. The tool will show you all of the shares on the network in a single window and list the access privileges to boot. If you only want to see local privileges, Sysinternals gives you a choice of two tools: AccessChk and AccessEnum.
AccessChk outputs an exhaustive list of a user's rights at file, service, or registry level at the command line, giving you a quick overview of how access privileges are defined for a specific user.
To see the privileges for the administrator in the C:\Windows\System32 directory, you would type accesschk administrator c:\windows\system32. For each file, you are told whether the user has read (R), write (W), or both (RW) types of access. If you use | more to redirect the output from this command, the display will pause on each page, and you can continue by pressing any key. In a similar fashion, >file.txt redirects the output to a file. With this approach, you do not see any command-line output.
The accesschk user -cw * command shows you the Windows services to which a group or user has write access. If you want to see a user's access privileges for a specific registry key, the accesschk -kns contoso\tami hklm\software command is your best bet. The AccessChk tool is excellent for checking computers for vulnerabilities, and it also supports scripting.
AccessEnum gives you a GUI that presents a full directory tree of user privileges. In other words, AccessEnum is the graphical front end for AccessChk. The download contains both files because AccessEnum relies on the AccessChk program for performing scans. In the GUI, you can select a directory and scan it for privilege assignments. The tools also show denied privileges.
Conclusions
The free command-line and GUI tools in the Sysinternals suite are a feature-rich addition to any Windows administrator's toolbox. The individual programs are useful for monitoring processes, users, and network connections, and tools like AdInsight are indispensable aids if you need to troubleshoot Active Directory logins.
