
Maatkit tools for database administrators
Order into Chaos
Maatkit [1], which was named after Maat, the Egyptian goddess of order and justice, gives administrators and developers a comprehensive collection of command-line tools written in Perl that helps extend the functionality of database management systems (DBMSs) and facilitates management tasks.
For example, you can check to see whether replication is working correctly, identify and repair damaged files, quickly export tables into files, parse data from files, or output the privileges assigned to individual database users.
Most of the features were written for MySQL [2]; however, Maatkit does support other free database management systems, including PostgreSQL [3] and Memcached [4].
Maatkit was developed in 2006 by Baron Schwartz. Since 2008, Daniel Nichter has been the main developer, although Schwartz still contributes suggestions for new tools and features. Both Schwartz and Nichter work for database specialist Percona, which has often impressed users in the past with performance-boosting patches for MySQL [5].
Maatkit installs with just a couple of keystrokes. Many package repositories include the tool selection, but, if this is not the case with your distribution, you can download the source code and DEB or RPM packages off the project website. To download and start using an individual tool quickly, you can also try:
wget http://www.maatkit.org/get/ toolname
Maatkit currently includes 30 tools; Admin magazine picked a couple of them for closer inspection.
Fast Dump and Restore
Wherever you need to roll out a new system, you need to test it thoroughly up front, preferably with real data. Because the data typically will be accessible, you can transfer the individual databases to the system you need to test.
MySQL includes the mysqldump tool for creating a dump of the database. This action just copies the content of a database, or all databases, to a file, which the other system then just reads.
The mysqldump command does this reliably, but slowly, because it backs up all the databases and tables sequentially. If you have a system with seven databases and only one of them is slightly larger, doing
time mysqldump --skip-opt --create-options --database datenkrake wikkawiki piwik sprzblog mysql limesurvey -uroot -ppassword > backup.sql
will take 21 seconds to complete:
real    0m21.626s
user    0m0.000s
sys    0m0.000s
In the case of larger databases on non-replicated servers, mysqldump is practically no longer an option because it locks the tables for the duration of the backup (to ensure consistency).
Maatkit has the mk-parallel-dump command to accelerate this process by transferring the data to files in parallel – assuming you have a system with multiple CPU cores.
By default, mk-parallel-dump uses two threads to copy the databases, but you can increase this number, assuming your hardware supports this, by setting the --threads option, thus substantially speeding up the dump.
On my test system, mk-parallel-dump did the same job nearly twice as quickly as mysqldump (Listing 1).
Listing 1: Parallel Dump
01 $ mk-parallel-dump -uroot -ppassword --database datenkrake,wikkawiki,piwik,sprzblog,mysql,limesurvey  --base-dir=db-backup/
02
03 CHUNK  TIME  EXIT  SKIPPED DATABASE.TABLE
04    db 11.43     0        0 datenkrake
05    db  1.34     0        0 limesurvey
06    db  2.75     0        0 sprzblog
07    db  2.67     0        0 mysql
08    db  3.45     0        0 piwik
09    db  2.50     0        0 wikkawiki
10   all 13.63     0        0 -
Schwartz warns database administrators not to use mk-parallel-dump as a backup solution. If you work with really large tables, you will soon notice why. The tool accesses mysqldump but without necessarily enabling its Quick option. Thus, the data must fit into the available RAM before it is written to a file. If the tables are too big to allow this, the system will start to swap, or mk-parallel-dump will throw errors before continuing.
If you don't see the error message, or you run mk-parallel-dump as a cron job, you might be in for a nasty surprise when you try to restore the results. The counterpart to mk-parallel-dump is mk-parallel-restore, which writes the tables you copied back to the database and again uses multiple threads to do so.
Stress Test for the DBMS
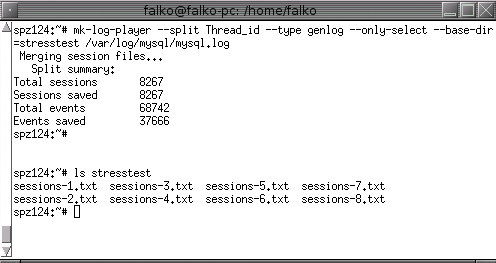
If you want to test the performance of your database management system, the Maatkit suite includes the mk-log-player tool. To see what the tool actually does, type:
mk-log-player --split Thread_id --type genlog --only-select --base-dir=stresstest /var/log/mysql/mysql.log
This command line tells Maatkit to explore the MySQL logfile for write access and create contiguous session files organized by thread in the stresstest directory. Then you can run these in parallel against the database management system (Figure 1). Tests like this make sense if you need to assess different configurations of your database management system.
After creating the sessions, you can type:
mk-log-player --play -uroot -ppassword ./stresstest --base-dir results h=localhost
to send them to the database. By default, mk-log-player will issue all the database queries stored in the sessions to the database in two parallel threads. Note how long the database management system takes to process the queries and write the results for each thread to a separate file in slow log format, which you can then read with mk-query-digest.
Finding Slow Queries
Once you have a sufficient volume of logfiles, you can evaluate the files with mk-query-digest. By default, the tool will use the slow query format, although it can also interpret normal logfiles and binary logs or – if you can't access the database server directly – evaluate traffic captured by tcpdump. Each query is fingerprinted so that you can group identical queries, such as SELECTs or UPDATEs, and evaluate them separately.
The output from mk-query-digest on the basis of the stress test shown in Figure 2, shows that some 19,200 queries composed of 55 different commands were issued. The system, a server with 768MB of RAM and a Pentium 3 CPU, took a total of 22 seconds to answer – the longest response took 32 milliseconds and the shortest was 126 microseconds – with a mean server query response time of less than 1 millisecond.
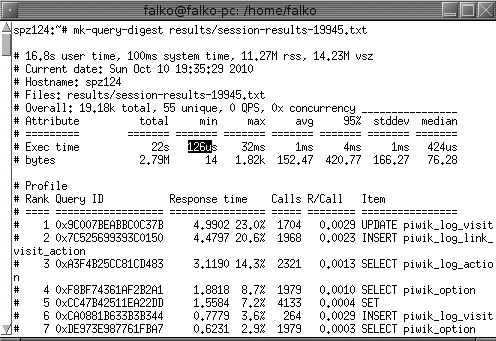
Lower down, the tool lists the 19 queries that occupied the most server time. In this example, the database management system took longest to serve the Piwik web analysis tool (Figure 3).
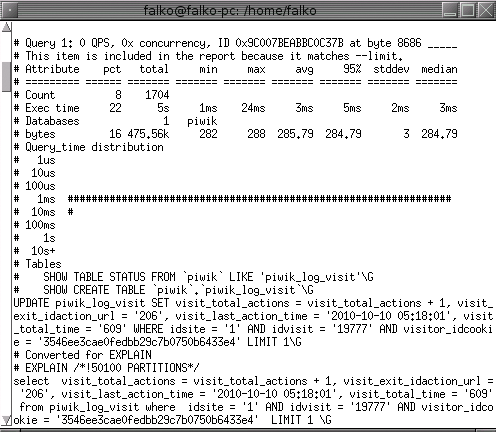
Following the overview is a more detailed analysis for the 19 "top consumers" that provides an idea of where bottlenecks are occurring and whether you can optimize for them. The mk-query-digest command offers more than 50 command-line options that database administrators can use to specify, for example, whether they want to query a specific database at a specific time of day or see the results in a different order.
When the Going Gets Tough
Occasionally, database servers run queries very slowly or not at all because something is amiss in the system. The mk-loadavg tool can analyze a variety of server performance indicators.
If the results are interesting, the tool will tell the administrator or query other system values and log them for analysis purposes. An interesting event could mean an active MySQL thread exceeding a defined threshold, the server starting to swap, the CPU running at full load, or a lack of responsiveness from the database management system.
The call in Listing 2 runs as a daemon and queries the InnoDB status every 60 seconds. If more than 15 read requests are waiting to be processed, the tool uses a mail-to-text gateway to send a text message to the administrator, who can then resolve the issue.
Listing 2: mk-loadavg
mk-loadavg -uroot -ppassword --watch "Status:innodb:Innodb_buffer_pool_pending_reads:>:15" --daemonize --pid /var/run/mk-loadavg.pid/--execute-command 'echo "DB Server hangs" | mail -s "falko@web.de" 017966666666@sms.web.de'
Unused Indexes
Indexes should normally accelerate access to the records stored in your tables. As the system grows, or when you change something, indexes you used previously can become redundant. Creating and updating them still takes up valuable space and time, so you should find out which indexes are not being used for queries. To do so, all you need is a slow logfile. If mysql-slow.log doesn't reveal much, you can also convert the normal logfile to slow log format with the use of mk-query-digest:
mk-query-digest --type genlog --print /var/log/mysql/mysql.log.1 > index.log
Then,
mk-index-usage index.log -uroot -password --host localhost
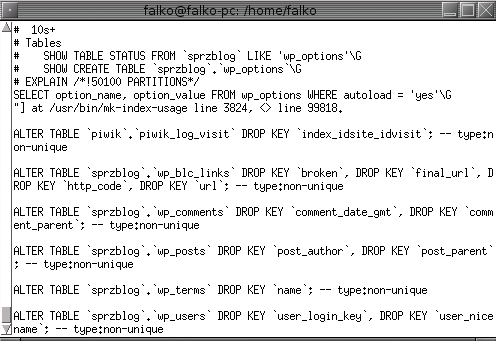
analyzes the logfile and checks for unused indexes.
As a result, the tool suggests removing non-unique indexes and provides the matching ALTER-TABLE instruction (Figure 4). The mk-index-usage command is not restricted to non-unique indexes; you can use the --drop option to extend the criteria to primary and unique types of indexes, and you can restrict the tool's activity to selected tables and store the results in a database.
Heartbeat
If you use replicated systems, you might not immediately notice a slave failure. Maatkit includes the mk-heartbeat tool, which tests once only or continually to discover whether a slave is still alive. To do so, enter the following line
mk-heartbeat --database --update --uroot -ppassword
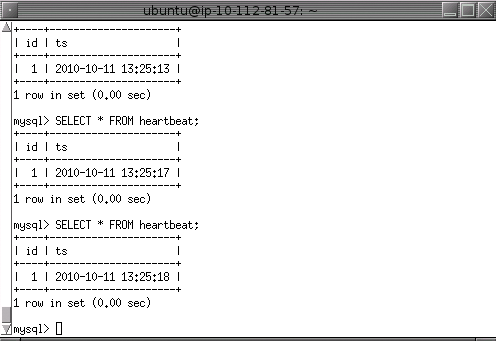
which writes continually (once a second by default) to a definable table on the master (Figure 5). Then, in a second (parallel) step, issue
mk-heartbeat --database maatkit --monitor -ureply -ppassword -h slave
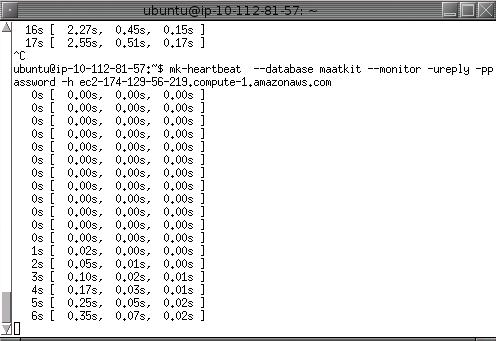
to check when the slave applied the change.
A table lists how quickly the server responds on average (see Figure 6). Time windows of 1, 5, and 15 minutes are used by default to evaluate responsiveness; however, you can change the defaults as needed. If a component fails, or if the synchronization process is too slow, you will soon notice.
Besides continual monitoring, you can run --check instead of --monitor for an individual query, and --daemonize lets you run heartbeat monitoring as a background process.
Staff and interns come and go, applications are retried, and you can soon forget former staff and their database access privileges.
Some users don't immediately forget their passwords after leaving an organization, which can lead to a security risk.
In another scenario, you might want to transfer the rights for one database management system to another. The mk-show-grants tool lets you query the privileges you have granted in just a couple of seconds.
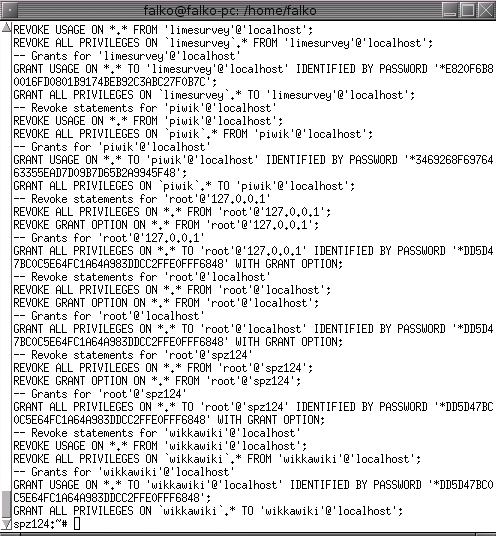
The results of the query are a list of SQL instructions, just as with many other Maatkit tools. In the case of more extensive database management systems, you can send the output to a comma-separated list, restrict the list to privileges for specific users (--only), or exclude users from the evaluation process (--ignore).
The --revoke switch generates REVOKE instructions to match the GRANT instructions that it discovers (see Figure 7).
Conclusions
The tools I looked at in this article represent just a tiny subset of the Maatkit suite. For more information, you can browse Maatkit's documentation. All of the tools are based on production needs, have been tested multiple times, and can save administrators a huge amount of work.
