Generating information with the touch of a button
Make It Snappy!
From sales to purchases to basic customer information and beyond – by itself, data is not useful until it is analyzed or processed into a form more easily understood by humans. Visualizing data in different forms can support a company's decision-making process, providing not only historical and current states, but also providing predictions about how things might evolve in the future.
Going into the details of data analysis is beyond the scope of this article. Instead, I am going to talk about some tools meant to help you access and present data, beyond simply drawing a few color graphs. In fact, graphing is just one small part of reporting, and being able to display data graphically and from different data sources is pretty much a given.
The Shape of Things
To go beyond simply executing queries against a database and displaying the results in tables, you must be able to perform so-called "data transforms," whereby the retrieved data is sorted, grouped, summarized, and perhaps even filtered. Although these are common processes within an SQL query, often the difficulty is in performing all four steps in a single query.
To be useful, your tool needs to access all of your data sources. If the application provides a Java Database Connectivity (JDBC) interface, it can probably access data in many contexts. However, you might need to find and install a database-specific file (e.g., a JAR file), which could be the difficult part.
Not universally available is the ability to display data conditionally (i.e., displaying a field when certain criteria are met). Although logic often can be written into database procedures, you would require knowledge of both SQL and your particular database that most report or business intelligence developers do not have. By shifting this kind of logic to the reporting tool, developing complex, dynamic reports becomes easier. Some applications provide varying levels of scripting so you can react at run time on the basis of the data returned.
Pictures are worth a thousand words, so you'll want to include graphics in your reports. Some tools only allow you to embed static images, which means you need another tool to create graphs, charts, and so forth. The high-end tools can do this at run time.
Modern spreadsheet applications provide a certain amount of functionality in terms of presenting data. Typically, they can even read data from external sources (e.g., a database) and not only process the data (e.g., grouping data and calculating maximums, means, and so forth) but also present the data in a professional format. However, the more data sources you need to include and the more complex the processing, the more cumbersome such tools become as you attempt to meet your needs.
GNU Enterprise Reports
GNU Enterprise Reports [1] is part of the GNU Enterprise (GNUe) package, which includes various tools and packages intended to implement "full Enterprise Resource Planning" (ERP). GNUe Reports depends on the GNUe Common package, and version 0.6.9 was available through Yum. The current version of GNUe Reports is 0.2.0 and is available directly from the GNUe website as .deb packages, although the packages are available as .zip or gzipped tar packages as well.
Installation was pretty straightforward, except the .tar.gz files were not really gzipped tar archives, so the command tar xvz failed with the error tar: This does not look like a tar archive. They turned out to be gzipped tar archives that were gzipped a second time. The entire GNUe platform is written in Python, and when I tried to start GNUe Reports, but I found that it requires Python modules that are not installed by default.
Documentation is very superficial, and I had to do a Google search to find a reference that finally led me to the mailing list. Other than that, I eventually did find two man pages: one for the GNUe Reports Server and one for the GNUe Reports Client. As you would expect from man pages, they didn't have much about actually creating reports, just about how to use the tools.
Most common databases, like Oracle, PostgreSQL, MySQL, and MS SQL Server, are listed as being supported, but I found no details about connecting GNUe Reports to any database at all. Additionally, unlike other tools, it has no GUI that allows you to create reports; apparently, the only way to create reports at this time is to edit the XML files directly. Although several sample reports are provided, I found no details in any of the documentation.
From what I was able to glean from the site and mailing list, the state of the entire GNUe project is unclear. The latest news item is from December 2009, and even people working on the project are not sure of the status of different components. Documentation for the various components differs as much as the release levels.
Although GNUe Reports seems intended to run primarily as part of the GNUe packages, I found references to a GNU Enterprise Designer 0.5.7, released in August 2005. Although it was intended to be a rapid application development IDE for the GNUe Forms package to simplify development of reports, because the development of the Designer has remained stagnant while other components have progressed, as of this writing, no version of the Designer works with the latest version of the other components.
As with other reporting tools I looked at, the report definitions are stored as XML files, which GNUe Reports uses to generate XML output. This makes a report "output independent" but allows it to be processed further to create a range of other output formats, such as HTML, PDF, and even Excel.
Although GNUe is a nice idea, I got nothing out of GNUe Reports.
OpenReports
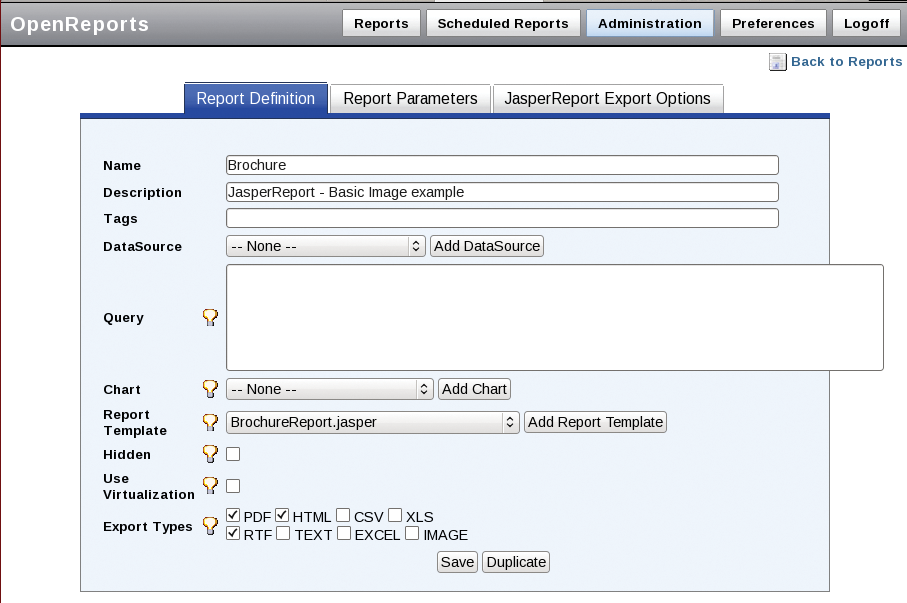
OpenReports is a web-based report management tool that supports all of the major report engines and can be managed from a web browser (Figure 1). Most common output formats are supported (e.g., PDF, HTML, CSV, XLS, and RTF), and you can manage not only the reports and their respective parameters from your browser, but also users and groups. Furthermore, you can schedule reports using the built-in scheduling engine or through cron.

Unfortunately, my experience with their website portended trouble ahead. After getting a number of MySQL errors and having to restart my browser, I discovered the package is available on SourceForge [2]. The product is Java based and released under the GPL public license version 2. The most recent version (3.2) is from May 2009.
Although two packages are available for download – the standard package and a Tomcat "bundle" with a Tomcat server, which you are told you can run "immediately" – I found out later that both packages contain Tomcat, and the only difference between the Readme files of the two versions is the copyright. Unfortunately, the latest Tomcat bundle is version 3.0, released in 2007 (the current non-bundled package is 3.2). The documentation indicates that OpenReports was designed to run on Windows and that Linux was more or less an afterthought because it specifically mentions Windows XP/2000. Also, the program is expected to run from c:\openreports-tomcat by default.
Unfortunately, running OpenReports "immediately" was far from true. Despite what the documentation said, you could not simply run startup.sh because the scripts had apparently been saved with a Windows editor, and Linux shells can have problems with the superfluous Ctrl-M's at the end of each line. This apparently was the case with all of the shell scripts because each time I changed one script, the next one failed with the exact same error.
Eventually I managed to get Tomcat to connect to OpenReports and log in as the administrator. OpenReports uses Hibernate [3], which provides cross-platform database access. So if Hibernate supports your database of choice, you should be fine. Although not specifically stated as "supported," the documentation very briefly describes how to configure MySQL, MS SQL Server, PostgreSQL, and HSQL.
The online documentation, which is for version 3.0, is very superficial, consisting only of the installation guide, and a Flash demo on their website is for version 2.0. Each package also contains a PDF version of the install guide, as well as the admin guide, which can also be downloaded separately from SourceForge. Neither has much detail. The project forums on SourceForge had a sub-forum for OpenReports Designer, but I could not find it anywhere.
A "professional" (read: commercial) version of OpenReports is available for US$ 495. In addition to the features of the free version, it includes a dashboard that can be used to configure alerts on the basis of information contained in the reports, thus supporting conditional report scheduling.
If you are willing to fight through the installation problems, OpenReports has the benefit of managing reports through a web browser. But after my experience, I seriously question whether it is worth the hassle – particularly when considering the advantages of other tools.
OpenRPT
OpenRPT [4] is part of the commercially available xTuple ERP package and leaves a fairly professional impression. Although OpenRPT is available as part of various xTuple ERP packages, it can also be installed as a standalone package, as I did for my test. Despite the similarity in names, it is by no means the same product as OpenReports.
OpenRPT is available from SourceForge [5] and is released under the GNU Lesser General Public License. Written in C++, the latest release, 3.2.0, dates from November 2010, which makes it one of the most up-to-date products I looked at.
From what I saw on the xTuple website and in the documentation, the products seem fairly Windows-centric. However, in contrast to other packages I looked at, the installation was incredibly easy. In fact, no real installation was necessary. After downloading and unpacking the OpenRPT file, it just worked.
The entire xTuple ERP package is supported on Windows, Mac, Linux, and various Unix dialects. Currently, database access is only officially supported with PostgreSQL and "Generic ODBC connections." However, as the documentation describes, "with a little work," Oracle, MySQL, and other databases can be used. To avoid any problems with my tests, I installed PostgreSQL and then loaded the test data OpenRPT provides. Unfortunately, I could find no references to being able to select multiple data sources, such as one MySQL database and one PostgreSQL, or even two different PostgreSQL databases.
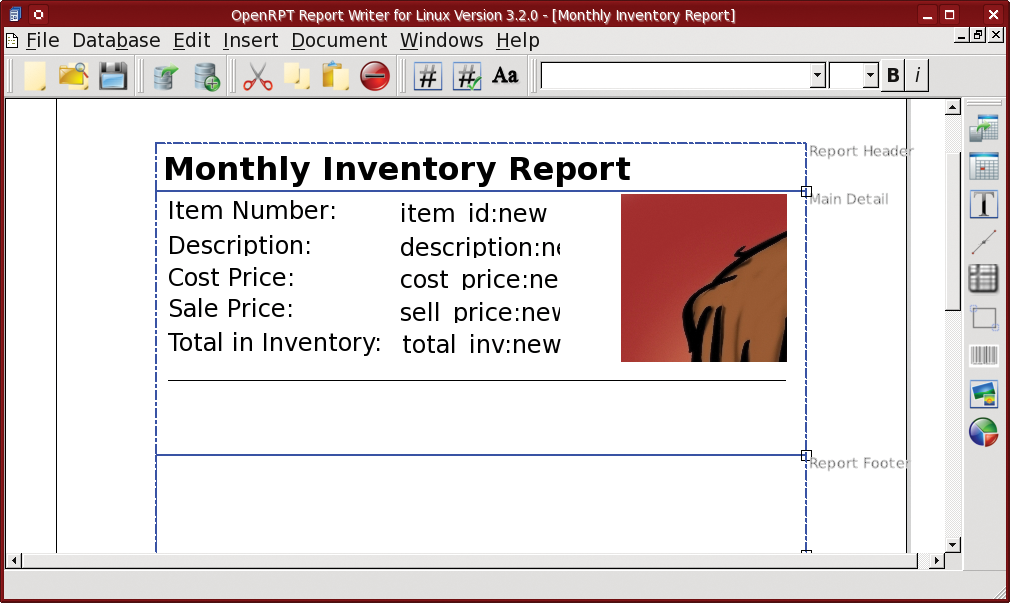
OpenRPT includes an easy-to-use WYSIWYG report designer (Figure 2). One aspect of "easy-to-use" is unfortunately limited functionality compared with some of the other packages.

However, for basic reporting, it does a fairly good job, particularly if you implement the other xTuple packages. Furthermore, it provides several useful features for formatting the report, such as multiple columns, multiple detail sections, and multiple group headers and footers for each of the detail sections. Reports are stored as XML, which seems more or less standard today.
The Query Editor is a very simple text editor in which you input your desired query. One annoying aspect was that I had to connect to the database each time I started the report editor, whereas other programs save the connection information for you. One limitation I found was the inability to create sub-reports – that is, being able to combine several different reports into a single master report.
The online product and reference guides are fairly extensive, and I was able to find a lot of what I was looking for quickly. Another positive is that the forums are well used, and I received a response in less than a day to the one question I posted.
An interesting aspect is something called MetaSQL, which is a scripting language developed by xTuple for use within OpenRPT. Within an SQL query, which works much the same way as PHP within an HTML page, portions of the query are surrounded by <? ... ?> tags, delimiting the MetaSQL code.
This notation allows you to create dynamic queries (i.e., using passed parameters) and includes a dozen or so language constructs or functions, such as if-then, for-each loops, ifExists, etc. These kinds of queries also can be used to accept parameters, which enables you to create report templates.
Also provided is a report renderer, which is a command-line tool used to render the reports. A range of switches are available that can be used to connect to the appropriate database, pass report parameters, and even define the output format or printer.
As mentioned, xTuple ERP is a commercially available product, and I was pleased to see they publish the prices on their website instead of asking you to call for pricing. Standard pricing is per user per year, ranging from US$ 350 for up to four users of their PostBooks Edition, to US$ 600 for 75+ users running their Manufacturing Edition. They also provide a Perpetual License and even a cloud version.
Eclipse BIRT
Once I got it running, Eclipse Business Intelligence and Reporting Tools (BIRT) had a very professional look and feel. I installed Eclipse BIRT 2.5.2 [6] through Yum, and it required dozens of other packages. Additionally, the BIRT installation page says you have to install both the Eclipse Graphical Editing Framework (GEF) and Eclipse Modeling Framework (EMF) packages, which were also available through Yum. Surprisingly, this didn't work and it was not immediately obvious why.
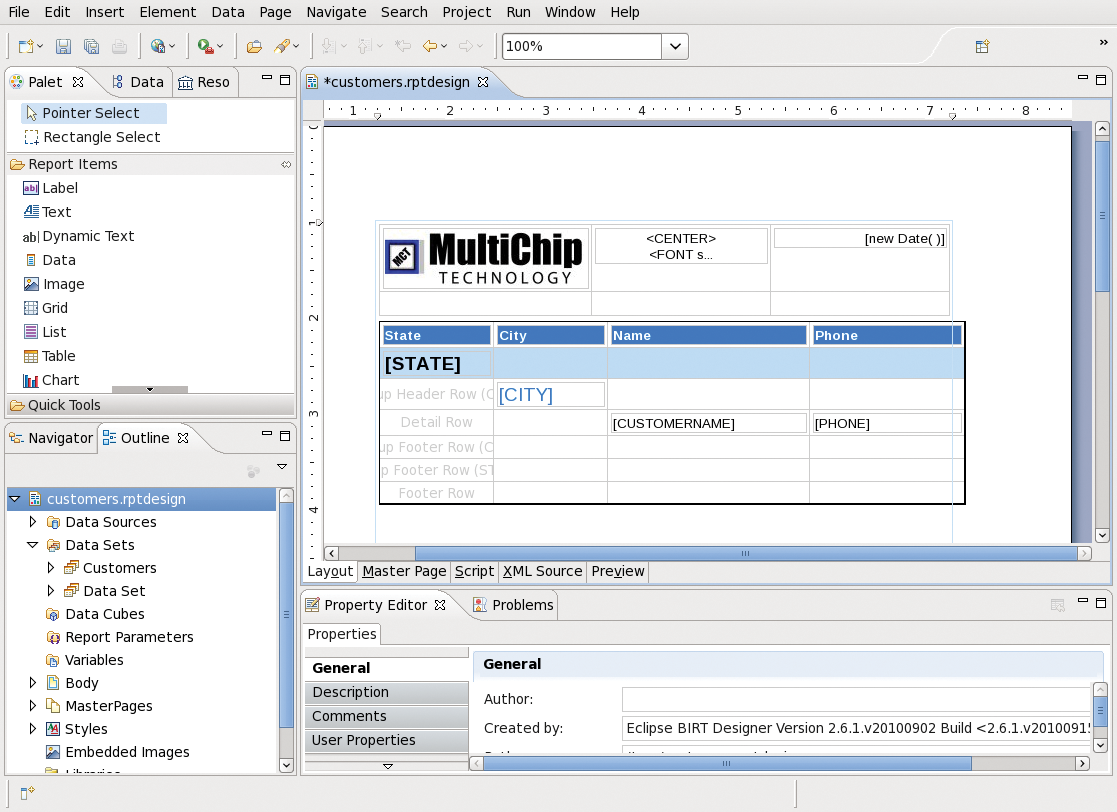
Fortunately, you can download an "all in one" package, which contains version 2.6.1 (currently the latest) and which you simply unpack and run. This method actually did "just run" without any problems, and I could easily open the report designer (Figure 3).

The package also provides a sample database and a number of example reports, which makes testing relatively complex reports fairly easy.
Eclipse BIRT supports JDBC, XML, and file-based data, as well as the Open Data Access (ODA) framework. Additionally, a single master (or compound report) can be created that contains data from multiple data sources. Each of these reports can contain tabular data as well as graphs, charts, and so forth.
If you are familiar with the Eclipse IDE and thus various "perspectives," the report designer is very straightforward because it is just another perspective within the Eclipse framework. Admittedly, I do not use Eclipse for development, and I haven't looked at it in several years. As a result, I felt it was not as intuitive as other tools and often was more cumbersome to use.
Eclipse BIRT comprises two components: the reports designer and a run-time component that you can add to various application servers. In this way, you can develop reports with the Eclipse BIRT IDE and then use the run-time version to deploy the reports with your application.
Creation of reports is done more or less by drag and drop. Report elements, such as fields, static text, and so forth, are dragged to the editor window and positioned with the mouse.
The graphical query editor took a little while to get used to, but once I figured it out and got through its quirks, it was a lot easier to use than the counterparts in other products.
One aspect I found interesting was the "visibility" of a given object that allows you to define when specific conditions occur. Although other tools have this capability, the way Eclipse BIRT implements the feature makes it very easy to use.
Thus, you can create very dynamic reports and so-called "event handlers" in either Java or JavaScript that process your data and change the appearance as necessary.
The detailed tutorial on the Eclipse BIRT website leads you through the process of creating a report step by step and includes a good introduction to the Eclipse GUI, which is nice if you are new to Eclipse. I was disappointed with the lack of screen shots; however, several videos are available that do provide a visual description of the tool.
The "BIRT Community Wiki" is unfortunately like so many wikis, in that it contains a lot of loosely related documents but no obvious single source for reference information. However, if BIRT is installed properly, you will find that the built-in help contains a great deal of information.
Nonetheless, in a number of cases, certain functionalities were described merely as possibilities, with little or no detail about how to go about achieving them. Also, I found some of the terminology somewhat unclear at first, possibly because I do not use Eclipse, and I had to go hunting for the explanations of some report-related terms.
BIRT Exchange [7] provides a range of additional features, services, and information in support of Eclipse BIRT.
Besides seeming more extensive than the Eclipse website, BIRT Exchange has a number of commercial offerings, including BIRT Designer Pro, which offers a number of features that are not available in the non-commercial product.
Despite any negative perceptions I might have given, I think Eclipse BIRT is a nice tool. Any limitations that I found were easily compensated for by the power of Eclipse.
JasperReports
Had this been a competition, the winner would have been JasperReports [8] by a long shot. Although Eclipse has as definite advantage if you also develop with Eclipse, if all you are interested in are the features related to reporting and business intelligence, JasperReports has the upper hand.
From what I saw, JasperReports provides the widest range of operating system, application server, and data source support. Windows is supported from XP to Vista to 2008 Server. Linux is supported with Red Hat, SUSE, Debian, Ubuntu, and CentOS, and it has direct support for Solaris and Mac OS X.
All the common application servers are also supported, including Tomcat, JBoss, WebSphere, WebLogic, and GlassFish.
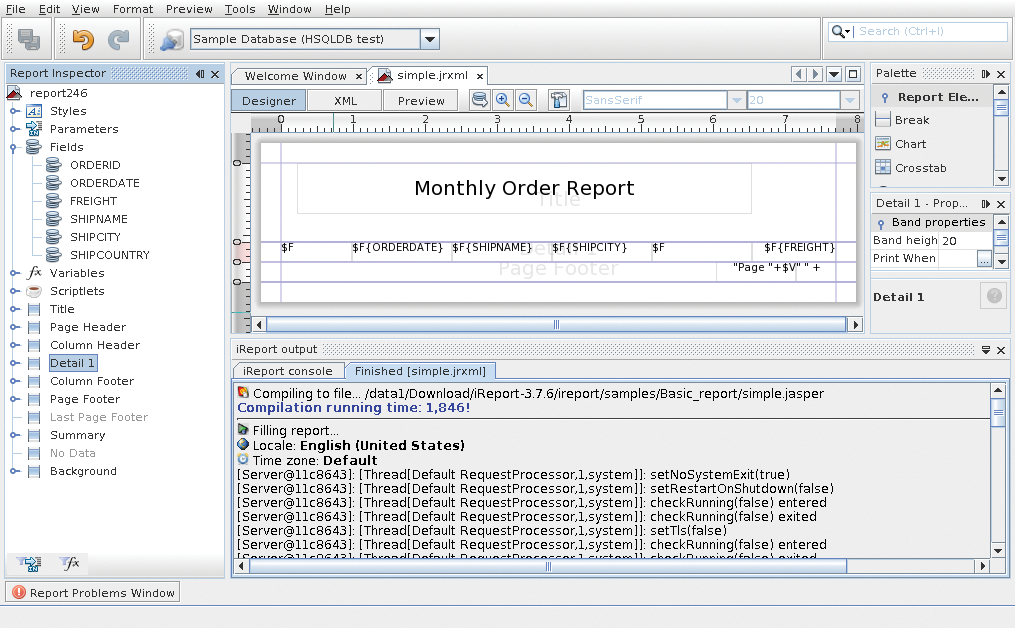
JasperReports is Java based and provides reports in several output formats (e.g., PDF, HTML, XLS, CSV, and XML) as well as to the screen or directly to a printer. Besides to the standard report elements that all the other products had, such as displaying data in tables, iReport can present data in tables, charts, and even gauges (Figure 4). Reports can also be specifically designed to be run as web pages, which allows you to create information dashboards very quickly.

Any JDBC 2.1- and SQL-92-compliant database is supported, although you might need to install an extra JAR file, as I had to do for Oracle support. In addition, a number of other data sources, such as JNDI, Mondrian, Hibernate, and XML, are supported.
Another key aspect is that reports are not just limited to a single data source. Not only can you fill your report with data from different databases, your report information can come from sources of different types (e.g., an Oracle database and XML files).
JasperReport is licensed under GPLv2. The commercially available JasperReport Professional provides additional features and support. Commercial support is also available on a per-call basis. However, my experience is that this is only really necessary if you are under time constraints and need to get your reports done now. The forums are well visited and provide a bounty of information, and the few questions I asked were answered in just a few hours.
For my tests, I was primarily interested in iReports (version 3.7.6), which is the JasperReports visual report designer. The functionality is similar to Eclipse BIRT, but I found the interface much easier to work in. When laying out my reports, I found it was much easier to get things exactly the way I wanted, particularly when I was trying to change multiple items in one go.
By itself, iReports is a powerful tool and enables you to create extensive reports quickly and easily. Both the report designer and the query editor are drag and drop.
For example, one window contains a list of the database fields, and you can simply drag these into your query. The query editor also contains syntax checking of your SQL statements, which definitely cuts down on development time.
Another key aspect of iReport is the ability to create sub-reports. In essence, these are standalone reports that can be inserted into a master report. For example, one sub-report could contain information from the CRM database about various customers, a second sub-report sales information, and a third production information, all of which could access completely different data sources.
When the report is run, you end up with a single look and feel across all of your reports. This ability is enhanced by formatting "styles," which can be included in a specific report or by using style sheets that you then include by reference, making them available across all of the reports in your company.
The reports consist of one or more "bands," such as title, header, detail, and summary bands. Bands, as well as fields and even sub-reports, can also be displayed conditionally. That is, if a band contains no data, you can simply tell iReports not to include the band.
Alternatively, you can have either the "Sales reached projected target" or the "Sales did not reach projected target" statement in one report depending on the data in a particular report.
The JasperServer also can be deployed as either as a standalone application or integrated with other applications. With the drag-and-drop dashboard, you can create quickly a graphical interface to all of you data sources. Depending on your needs, this can either be done ad hoc, whereby end users create dashboards as needed, or by creating a standardized dashboard available to the entire company. Note that the data is not static and can be reloaded dynamically. Naturally, it can also be parameterized to enable users to display the data they need.
All of the reports can be scheduled and then automatically distributed, either periodically (i.e., once a week) or with calendar-based scheduling. Additionally, reports can be stored in a searchable repository.
Although other products I looked at had user and group controls for specific reports, the JasperServer takes this one step further, in that you can define both row- and column-level data security, allowing access only to the data specific users are authorized to see, while allowing them access to a given report as a whole.
Also, reports can be versioned to maintain a historical record or audit-compliant reporting. The system also can maintain a record of which user ran which report.
The JasperServer front end uses Ajax and dynamic HTML, which allows users to create ad hoc queries quickly without the need to understand SQL or even the underlying database model. Instead, the necessary data is simply dragged onto the report, which can then be saved and shared with other users. Because all of the components are integrated, besides being able to display data conditionally, you can create scripts in either Java, Groovy, or JavaScript.
Conclusions
Because all of these tools are available as non-commercial products, cost shouldn't be an issue. If you are intimidated by products with a lot (perhaps too many) features, OpenRPT does a nice job of creating reports quickly. If you want added features and are not easily overwhelmed, both Eclipse BIRT and JasperServer with iReports are excellent tools.
