
Visualize data throughput with SMBTA
Traffic Report
The SMB Traffic Analyzer (SMBTA) tool is implemented as a VFS module that allows a Samba/CIFS server to record traffic statistics on a Samba network. The SMBTA daemon stores this information in a database and makes it available via SQL, for example.
The architecture is clear cut and comprises a module in the Samba VFS (Virtual File System), a daemon, and a set of client tools (smbtatools) for evaluation and visualization. SMBTA uses an existing SQL database (sqlite3) to store the traffic data.
The developer and inventor of SMBTA, Novell's Holger Hetterich, has been working on his Samba Traffic Analyzer since the SambaXP Conference in 2007. His work has attracted attention in expert circles – including the Samba team – which has led to Hetterich's holding well-attended keynotes at Samba Xperience and other events.
In the meantime, Novell has supported this work by allowing Hetterich to dedicate some of his working hours to the development of SMBTA. Unfortunately, the work hasn't aroused much general interest, mainly because feedback of all kinds has been handled directly by Hetterich and not via mailing lists or the usual channels; however, this is just a matter of public relations. Although right now, the number of users is fairly low, that's likely to change when version 3.6 of Samba, which will include SMBTA as an official component, is released [1]. Although experienced admins would have no trouble sniffing typical NetBIOS traffic by pointing a port sniffer at the usual suspects, SMBTA focuses entirely on Samba traffic. This approach allows administrators to create comprehensive and meaningful statistics because the tool performs genuine data mining centering on the SQLite database. For example, SMBTA will let you target an individual user, share, or file for statistical analysis.
The client side has basically three evaluation tools, all of which are part of the smbtatools package. An RRD (Round-Robin Database) driver and RRDtool [2] can be linked to the SMBTA daemon in real time – thus supporting visualization of the traffic data or ongoing processing by means of, say, Perl scripts – or with the use of IP or Unix domain sockets.
The smbtaquery tool can use XML to read the database. If you prefer a more visual approach, smbtamonitor also supports access to the stored data without the need to speak SQL.
Getting SMBTA
To try out SMBTA now, you can either download the source code for the current version, 1.1.2 [3], or go for Holger Hetterich's blog binaries for openSUSE [4]. General information on SMBTA is also available [5].
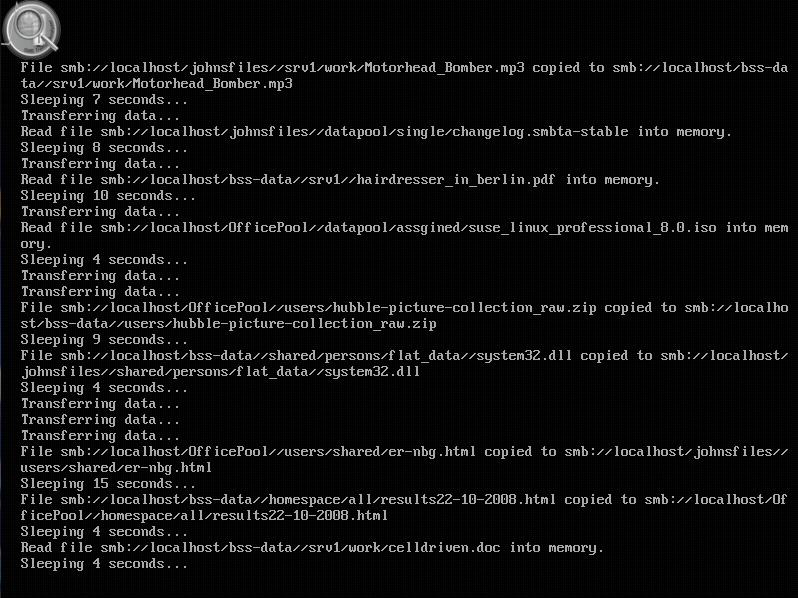
Because installing SMBTA means installing backports for Samba 3.6, users are advised to go for the RPM binary or the One-Click Installer on openSUSE 11.3.
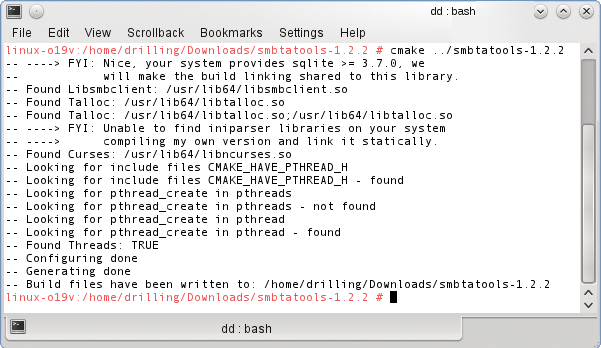
Of course, you can also use Git to check out SMBTA [6]. And, last but not least, SUSE users can add the package source [7] in YaST and then use the package manager to install SMBTA (Figures 1 and 2). An even easier approach to trying out SMBTA is to use Hetterich's "Stresstest" appliance, which is currently available as version 0.0.2 [8] (see the "Stresstest" box).
Installing SMBTA and smbtatools
If you would like to test SMBTA as quickly as possible but prefer not to install a dedicated Samba server in the process, you'll need to build SMBTA and the smbtatools from the source code (Figure 2). To allow this to happen, make sure that you have cmake, libsmbclient-devel, libtalloc-devel, and ncures-devel in place on your computer.
Additionally, you will need the SQLite3 database environment and the corresponding developer packages. Also make sure that libxslt is installed; it should be on openSUSE by default.
Now, you can unpack the source code, smbtatools-1.2.2.tar.bz2, and change to the resulting directory. Give the cmake command in the build directory to configure the package for the build process:
cmake ../smbtatools-1.2.2
Next, make and make install the compiler package and copy the programs to the correct location.
To start the daemon, type
smtad -u -n
which tells the daemon (u) and the client (n) to communicate via Unix domain sockets. The SMBTA daemon's main task is to feed data to the SQL database; it receives data from the VFS module.
At the same time, the daemon is also responsible for handling client requests to the database. Suppose you want to record all the traffic that occurs on a selected share; in this case, you would simply load the required VFS into the share definition:
vfs objects = smb_traffic_analyzer
smb_traffic_analyzer:protocol_version = v2
smb_traffic_analyzer:mode = unix_domain_socket
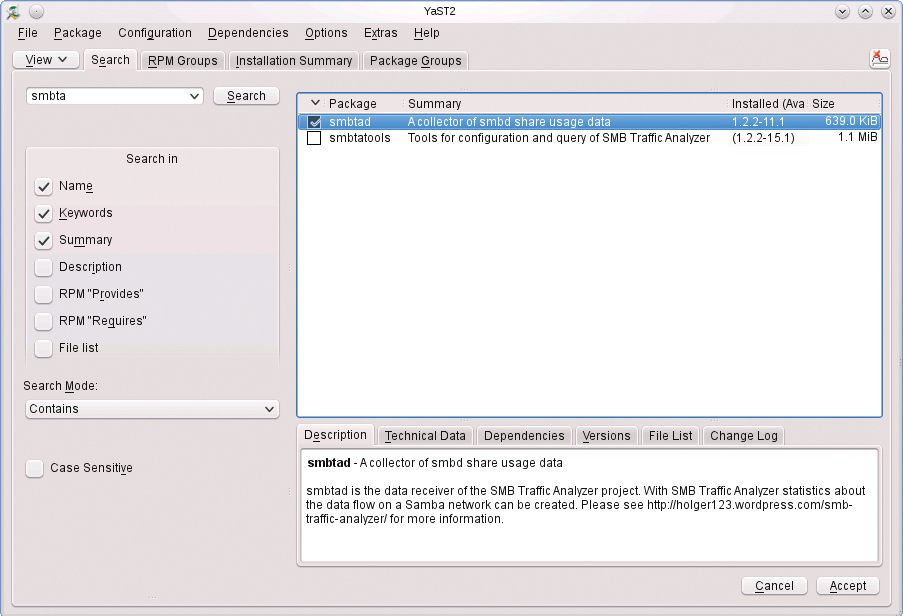
You can configure the final parameter here to suit your own needs (Figure 3). For example, if you prefer to use TCP/IP communications, the matching share definition would look like:
vfs objects = smb_traffic_analyzer
smb_traffic_analyzer:protocol_version = v2
smb_traffic_analyzer:host = localhost
smb_traffic_analyzer:port = 3490
In this case, you would launch the SMBTAD daemon as follows:
smbtad -i 3490 -p 3491
The daemon waits for requests to the VFS module on port 3490 and handles client requests on port 3491 (default). By default, smbtad creates its SQLite database in $HOME/.smbtad/staddb, unless this database already exists.
For an overview of the many other parameters, you can type:
smbtad -help
For an exhaustive explanation of all parameters, I recommend reading the excellent documentation, or you can store all the configuration parameters you need in an /etc/smbtad.conf file, which uses a typical INI file format and # as a comment character.
Using smbtaquery
As mentioned earlier, the available client tools include an RRD driver, the smbtaquery command-line tool, and smbtamonitor. Experienced administrators can use the SQL tools of their choice to inspect the internals of the traffic database. Having said this, smbtaquery does provide a more convenient approach – being specially designed for the SMBTA database setup and including a number of preconfigured queries. The smbtaquery tool creates the required XML output, which you can then convert to your favorite format, assuming you have an XSLT processor installed.
The XSLT processor draws on stylesheet information from smbtaquery. To facilitate queries to the database, smbtaquery includes a simple interpreter that is customized for cooperation with SMBTA. You have two options for using the internal interpreter. One option is to pass in a file that contains all of the query instructions. The filename is specified by the -f (file) parameter:
smbtaquery -h Host -i 3491 -f commandfile.txt
In profile and interpreter mode, each command must be separated by a comma and parameters by space characters. Each line ends with a semicolon. In the usual style, the configuration file uses # for comments.
Alternatively, you can use the internal interpreter directly. To do so, pass the -q (query) parameter to smbtaquery:
smbtaquery -h Host -i 3491 -q 'Query'
The -h and -i parameters here have the same meaning as previously. The -q for "query" sequence is followed by the query syntax,
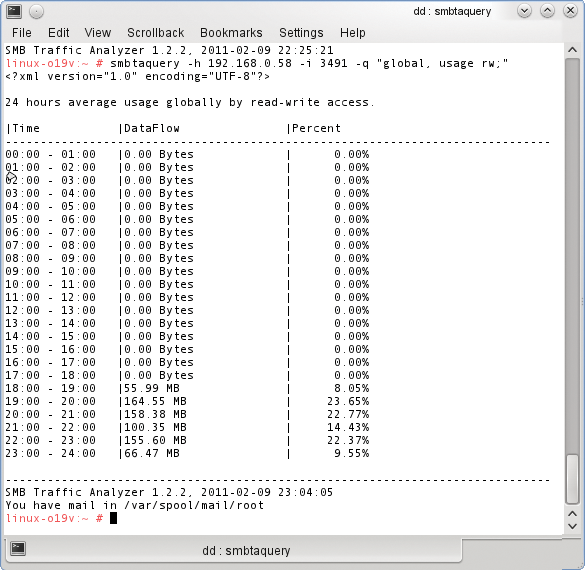
smbtaquery -h Host -i 3491 -q 'global, usage rw;'
where smbtaquery counts the global traffic on the complete Samba network. Of course, you could just as easily restrict traffic to be investigated to a single user or share:
smbtaquery -h Host -i 3491 -q 'user drilling, total w;'
Besides using hostnames and TCP ports, smbtaquery can also use Unix domain sockets for its bindings.
smbtaquery -u -q 'global, usage rw;'
Incidentally, smbtaquery sends all its output to the terminal on which it was started by default. Standard Unix operators redirect the output, as in > output.txt, or the -o parameter creates HTML-formatted output:
smbtaquery -u -q 'global, usage rw;' -o html > output.html
The excellent documentation has many examples of queries, such as,
'user drilling, total r;'
which evaluates the total number of bytes read by user drilling on the Samba network (r). Or,
'share USB-Fritzbox, usage rw;'
the usage function, shows a timeline for read/write access to the USB-Fritzbox share (an external hard disk connected to a router) over the virtual day divided into periods of 24 hours (Figure 4). Alternatively,
'share USB-Fritzbox, total w;'
discovers the absolute number of bytes written on the USB-Fritzbox share. The total function determines and shows the number of bytes read from/written to the specified object (share, user, total network).
Other powerful and interesting parameters, such as top, list, or last_activity, are detailed in the documentation.
Using smbtamonitor
The smbtamonitor tool lets administrators monitor all Samba traffic in real time. To do so, the client opens a direct connection to the smbtad daemon instead of picking up stored traffic information from the database. The daemon sends all the data packets received by the VFS module to smbtamonitor, which in turn listens permanently at the SMBTA socket and visualizes all received packets in a Curses graph.
To allow this to happen, each smbtamonitor instance binds to an object (user, share, or file – Figure 5). The admin can start as many smbtamonitor instances as needed.
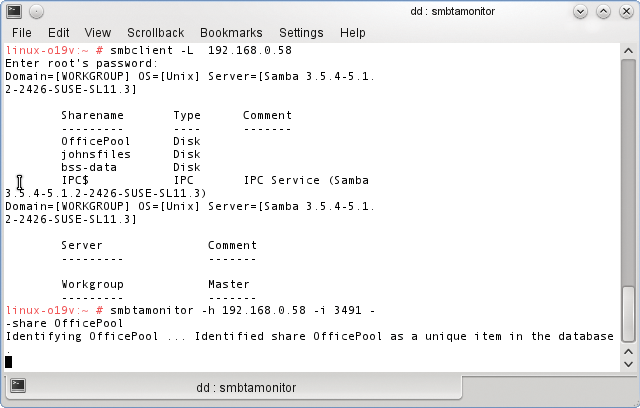
With this approach, you can, for example, use smbtamonitor to visualize the absolute number of bytes transmitted and/or data throughput per second for the object in question. The smbtamonitor tool needs you either to specify the host (-h) and port number (-i) or to initiate a connection by means of Unix domain sockets with the -n parameter:
smbtamonitor -h Host
 -i 3491 --share Release
The smbtamonitor tool can bind explicitly to a file. For example, you can visualize in real time if and to what extent users on the network have noticed a file with the name RELEASENOTE.TXT:
smbtamonitor -h Host -i 3491 --file RELEASENOTE.TXT
Incidentally, smbtamonitor can also use a $HOME/.smbtatools/monitor-config configuration file, which specifies the hostname and port number:
[network]
Hostname = SMBTA-Host
Port = 3491
Many other useful parameters are detailed in the documentation.
rrddriver
The RRDtool is renowned for its robustness and ease of use; it supports, for example, visualization of the throughput on a Samba share. RRDtool is available from the project website [2] and from the openSUSE repositories. It is easily installed with YaST (Figure 6).
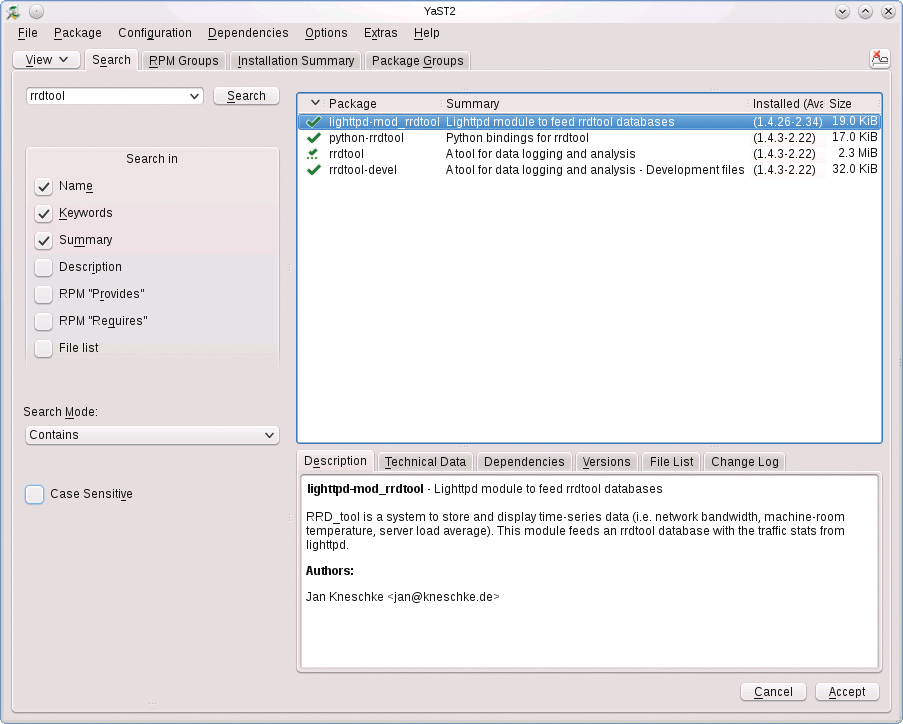
SMBTA itself contains the driver as an interface to RRDtool; the driver is called by the rrddriver keyword followed by one or more arguments (Figure 7). The arguments include the well-known -h (host), -i (TCP Port), -n (domain sockets), -s (share), and -u (user), as well as -r, used to define an RRDtool setup string. The default is:
DS:readwrite:GAUGE:10:U:U
DS:read:GAUGE:10:U:U
DS:write:GAUGE:10:U:U

An example of the use of rrddriver would look something like:
rrddriver -b meinrrd -h Host -i 3491 -user drilling
This command launches the RRD driver for all traffic information produced by user drilling. By default, RRDtool updates its database every 10 seconds, or you can reduce the interval to, say, two seconds with -S 2. You can then use the rich feature set of RRDtool. For more information, see the "RRDtool" box. The project website also provides comprehensive documentation. An example of a manual call to RRDtool is provided by Listing 1.
Listing 1: Manual Call to RRDtool
01 rrdtool graph fig-smb-throughput.png -s 1290772099 -S 1 --title "Data throughput on share 'johnsfiles'" DEF:read_in=testdb:read:AVERAGE DEF:write_in=testdb:write:AVERAGE "AREA:write_in#AA0000:Write" "STACK:read_in#AA9999:Read"
This call creates a PNG image – fig-smb-throughput.png – with the title Data throughput on share 'johnsfiles', which shows the read and write throughput on the specified share, triggered in Unix time format as specified by the -s parameter.
Conclusions
Measuring and visualizing data throughput on a network is not a difficult task. But, if you are specifically interested in data traffic created by the Samba CIFS server, a bona fide data-mining tool like SMBTA might be just what you need.
In any case, the Samba team has decided to incorporate SMBTA as a component of Samba 3.6. However, taking the current Samba architecture and, more specifically, the SMBTA architecture into account, the danger exists that the database used by SMBTA will grow very quickly.
As of this writing, I've not been able to discover how enterprise environments are planning to cope with this problem.
