Network monitoring for Windows
Made to Measure
The permanent availability of servers and the services they provide presents a challenge for any administrator. For this reason, network monitoring and the tools used to perform it play an important role in an administrator's ability to respond in case of an emergency.
PRTG
The PRTG Network Monitor [1], from the German company Paessler, can monitor any service, regardless of whether it is running on Windows or Linux, and can even monitor the availability of network appliances and determine the bandwidth consumption of network traffic. PRTG implements its monitoring features via Windows Management Instrumentation (WMI), the Simple Network Management Protocol (SNMP), and, in the case of a compatible router (e.g., Cisco), NetFlow or sFlow.
In the current version, you don't need to license NetFlow sensors separately; instead, each WMI or SNMP query counts as a sensor license.
An appliance you need to monitor may deliver various data, such as the CPU load, the incoming and outgoing network traffic, or even product-specific data like the number of connections on a Microsoft Internet Information Server (IIS). PRTG supports automatic detection, so all of the sensors available on a device are added automatically. To allow this to happen, administrators only need to know the username and password for Windows systems and the SNMP authentication credentials for Linux systems and network devices. Authentication can be configured globally or for each device.
PRTG integrates packet sniffing and thus is capable not only of monitoring sensors but also of discovering which application or IP address is generating large amounts of network traffic in the enterprise. This information can be determined by the network card of the monitoring server or via the monitoring port on a switch.
The PRTG developers have also taken virtualization into consideration. Administrators can check VMware, Xen, and Hyper-V hosts and, of course, the virtual machines that they host for availability and errors, just like any physical server system. Amazon CloudWatch helps monitor Amazon EC2 instances, keeping an eye on the performance of the rented instances.
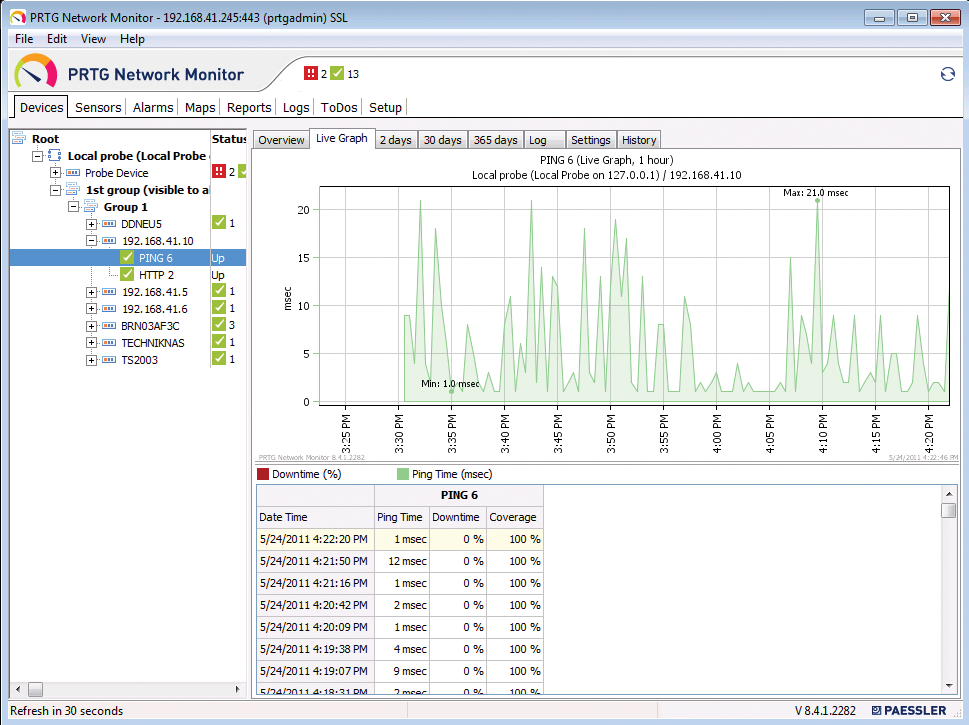
The PRTG Network Monitor provides its complete functionality in a web interface (Figure 1) and additionally offers a native Windows application (Figure 2) for a quick overview of the available sensors. A notification feature for warnings and errors can be integrated with the desktop or web browser as needed.


PRTG offers various notification options for keeping administrators informed of warnings and failures. Besides email messaging, this includes text messages and ICQ or Windows Live Messenger-based messaging. PRTG will also write syslog entries and SNMP traps or execute HTTP actions and programs when a warning or error occurs.
Many network monitoring solutions rely on Microsoft's SQL Server as the back end for storing historical data; in contrast, PRTG relies on a proprietary database. This approach has the advantage of faster data retrieval, because the information is stored in chronological order and only needs to be output in the stored order.
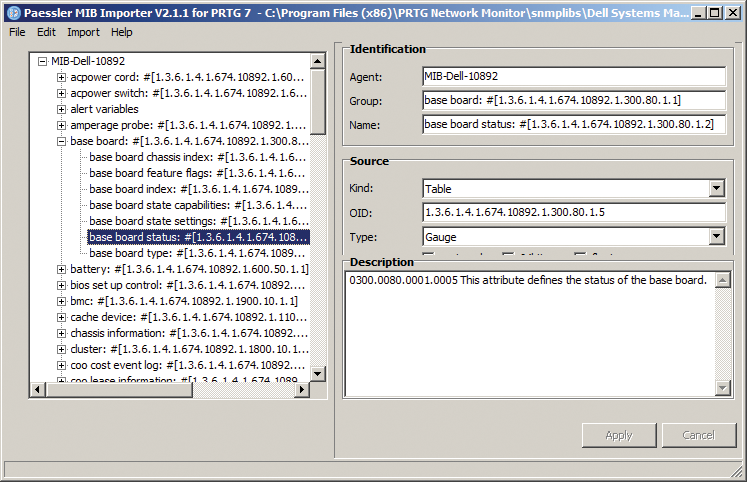
Most monitoring solutions let you add SNMP libraries, and PRTG is no exception; it relies on the free MIB Importer tool (Figure 3) to integrate indicators for network appliances that are not supported by default. This means you can integrate, for example, the APC Environmental Manager and display information about the current temperature and humidity of your server racks and rooms in PRTG.

PRTG doesn't include a solution for creating automatic network maps like those offered by, for example, WhatsUp Gold [2]; instead, the administrator must do this manually. The Map section in PRTG does offer several functions for creating your own maps with a variety of icons, and the integration of Google Maps lets you create country and world maps with various enterprise or server locations or both. You can enter the location to display in Google Maps for each device. This ability allows you to see both the Google Map integration view and the graphical view from the right-hand side of the device overview in the web interface (Figure 1).
PRTG also takes reporting seriously. Reports can be created as HTML or PDF files at the press of a button or at planned times. Reports can be stored in a directory, or they can be delivered conveniently as email.
The PRTG Network Monitor 8 license structure is simple and depends on the number of sensors required. Access via the web or Windows application is not restricted, in contrast to many other solutions.
Phone-Based Monitoring
Paessler also offers iPRTG, a commercial iOS app (Figure 4), and PRTGdroid, an Android app, for the PRTG Network Monitor that displays network and system status on an Apple or Android smartphone via a WLAN or mobile data connection [3]. This means administrators always have a full set of information on devices, sensors, alarms, and maps on the road.

So far, Paessler has not implemented a push service for messages to the iPhone as an alternative to text messaging. Instead of using the smartphone app, you can use the mini-HTML web interface to access your monitoring data with any smartphone platform.
Free Failover Cluster
Each license of PRTG Network Monitor includes the deployment of a free failover cluster license. In other words, you can deploy the software on a second system, or even at another site, and continue monitoring your network if your primary system fails. This means you don't have to invest in a second SQL server.
NetCrunch
In contrast to PRTG, NetCrunch by AdRem Software [4] focuses on the Windows administrative console (Figure 5), which is used for the complete configuration and visualization of the network you are monitoring. You can access the administrative console from any Windows client through the use of the connection broker, a small app in the taskbar info area, which opens a connection to the NetCrunch Server.

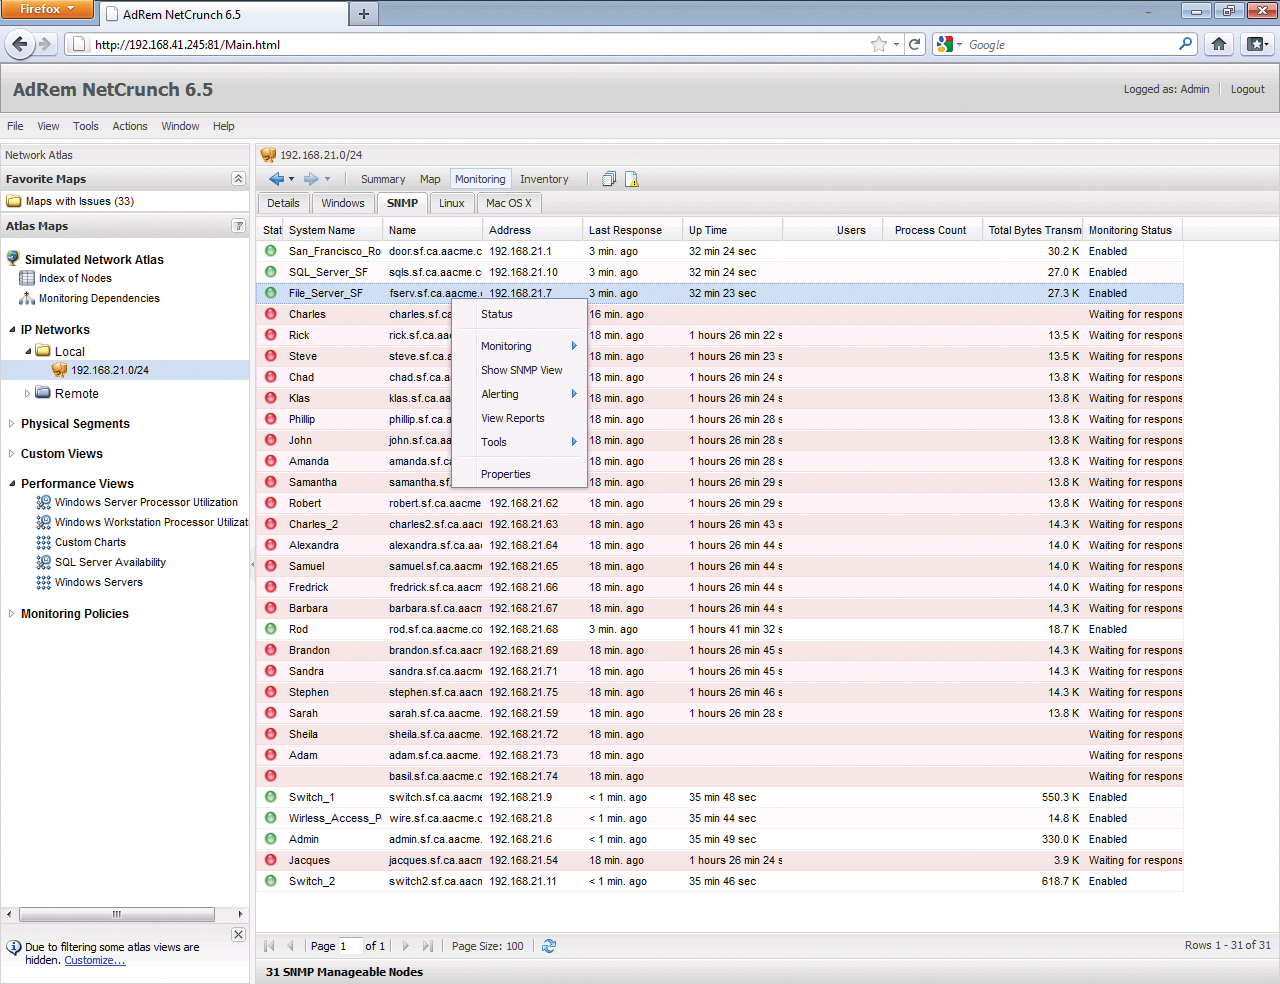
The connection broker displays warnings and lets you launch network analysis and diagnosis tools. Access via a web interface is also possible (Figure 6). Although this application does not give you the full feature set offered by the console, it does support browser-based monitoring, reporting, diagnostics, and analysis on the road or at home.

NetCrunch offers multiplatform support and, besides Windows, can monitor Linux (kernel 2.4 or newer), Novell OES, Mac OS X, BSD, and NetWare systems without needing to install an agent. NetCrunch can distinguish between virtual and physical machines and offers several performance indicators for monitoring the load.
Like PRTG, the NetCrunch database does not require additional licenses for storage of historical data.The NetCrunch report viewer is straightforward and offers detailed information on the individual nodes. You need to enable each report for data collection; after doing so, you can store the reports for later use.
NetCrunch automatically generates reports for scheduled long-term trend analysis and dispatches the reports to preconfigured email addresses. The WMI-based hardware and software inventory feature displays information for each system; it can provide a complete overview of the applications installed in the enterprise or write this information to a detailed report.
One of the biggest issues with network monitoring solutions is the variety of SNMP libraries for network devices. Because most vendors provide a separate library for their network products' performance indicators, a good monitoring solution must be capable of importing new libraries or compiling them. NetCrunch comes with SNMP MIB Compiler (Figure 7), which gives you precisely these options and integrates libraries from dozens of vendors out of the box.

NetCrunch's licensing is based on the number of systems you need to monitor, the number of connections (two administrators=two connections), and whether or not you want to use the integrated inventory feature.
Conclusions
Both monitoring solutions offer scalability, work independently of external databases, and can be managed at the office or on the road.
