Monitoring server hardware with the Nagios IPMI plugin
Server Check
Nagios and the Nagios fork Icinga have proven their value as software service monitors in recent years. So far, server hardware monitoring has been a complicated process that relied on vendor-specific plugins. The new IPMI plugin v2 supports simple monitoring, even in heterogeneous server landscapes. To do so, the plugin monitors all the IPMI hardware sensors for temperature, fan speed, power supply status, and many others.
IPMI (Intelligent Platform Management Interface) was introduced in 1998 as a cross-vendor server management standard by Intel, HP, NEC, and Dell. The current IPMI 2.0 specifically dates to 2004 and is supported by most recent server systems.
Entry-level servers often need an option such as a hardware extension card or a special mainboard variant for IPMI support. But, for all others, IPMI is typically standard equipment [1].
The heart of the IPMI specification is the Baseboard Management Controller (BMC), which uses the network or a local system bus to talk to userspace programs on one side and is linked to numerous hardware sensors in the server on the other. The BMC needs a separate IP address to communicate on the network. Once the server is connected to the power supply, the BMC boots automatically – regardless of whether the server itself is running.
Widespread IPMI support in the server sector provides ideal conditions for writing a Nagios plugin for simple and standardized server hardware monitoring. I released the initial version of my IPMI Sensor Monitoring plugin in October 2009.
In the background, the plugin relies on IPMItool to query the IPMI sensors. The plugin went to version 2.0 just recently and now has ipmimonitoring by FreeIPMI running in the background. The move from IPMItool to FreeIPMI was necessary to support digital (discrete) sensors in addition to analog (threshold) sensors in a reliable way. FreeIPMI is now included by an growing number of Linux distributions, such as RHEL/Cent OS as of version 5.2, Ubuntu as of version 10.04, and Debian Squeeze [2].
Threshold and Discrete Sensor Classes
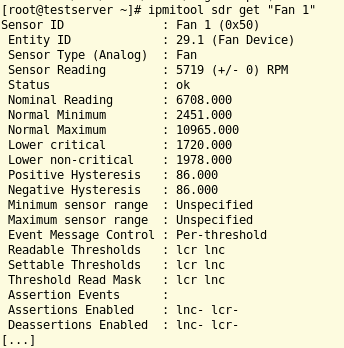
The two sensor classes, Threshold and Discrete, are standardized in the IPMI specification. Figure 1 shows a threshold sensor (Fan 1). A sensor of this kind delivers an analog value (e.g., 5,719 rpm) and provides some additional status information (e.g., "okay"). The sensor generates this information by comparing the analog measured value with the predefined thresholds. No upper limits are defined for this fan, but it has two lower limits: LNC (lower noncritical) and LCR (lower critical) at 1,978 and 1,720 U/min. This example reveals another benefit of the IPMI standard: The thresholds are defined by the server vendor. This saves you from configuring the limits manually in Nagios.

Figure 2 shows a discrete sensor (PS1 Status). This sensor provides status information for the first power supply but does not provide any analog values. Instead, the sensor shows which of its possible states exists at the current time. Multiple states can coincide, which is the case in this example. The states Presence detected and Power Supply AC lost are currently active. IPMItool doesn't generate a warning for the ipmitool sdr elist all query here.

In contrast, ipmimonitoring by FreeIPMI has precise mappings, of which discrete states should be interpreted as "okay" (Nominal), Warning, or Critical. These levels are equivalent to the Nagios states Ok, Warning, and Critical. You can modify the standard assignments for ipmimonitoring via the /etc/ipmi_monitoring_sensors.conf configuration file (Listing 1).
Listing 1: ipmi_monitoring_sensors.conf
01 # IPMI_Power_Supply
02 # IPMI_Power_Supply_Presence_Detected                    Nominal
03 # IPMI_Power_Supply_Power_Supply_Failure_Detected        Critical
04 # IPMI_Power_Supply_Predictive_Failure                   Critical
05 # IPMI_Power_Supply_Power_Supply_Input_Lost_AC_DC        Critical
Querying Sensors
Hardware sensors can be queried locally or across a network. Local access to the server via an IPMI system interface requires root privileges; however, this is easily done with sudo for the ipmimonitoring tool. This kind of query is useful for monitoring the Icinga or Nagios server itself and for hosts that you already query via NRPE.
Remote access also requires an IP address for the IPMI BMC, an IPMI username, and a password. The IPMI user here must be assigned IPMI Channel Privilege Level User privileges. If an attacker were to sniff the access credentials, he would be unable to reboot or power off the computer via IPMI. This danger would exist for IPMI Channel Privilege Level Administrator. The big advantage of querying via the network is that it is independent of the server operating system. Whether the server is running Linux, Windows, or VMware, you don't need to install an agent on the local operating system for the network query.
Integration
The following example illustrates IPMI monitoring of a server via the network. The server has an IPMI user with corresponding privileges. Basically, you need to integrate the IPMI plugin. This example is based on Icinga, but the configuration is identical for a Nagios system.
The prerequisites required forimplementing the IPMI plugin are the Bash shell, the FreeIPMI package, and Awk.
The plugin is available online [3]. After downloading, you can simply copy the plugin to the default plugin folder. You then need to define the command in commands.cfg to make the IPMI plugin available for individual host and service definitions (Listing 2). Next, use the Custom Object Variable _ipmi_ip to add the IPMI BMC IP address to the existing server host definition (Listing 3). The final service definition only requires the path to the FreeIPMI configuration file, which contains the IPMI username, password, and Channel Privilege Level (Listings 4 and 5).
Listing 2: Command Definition
01 define command {
02   command_name  check_ipmi_sensor
03   command_line  $USER1$/check_ipmi_sensor -H $_HOSTIPMI_IP$ -f $ARG1$
04   }
Listing 3: Host Definition
01 define host{
02   use           linux-server
03   host_name     centos4
04   alias         centos4
05   address       192.168.1.151
06   _ipmi_ip      192.168.1.211
07 }
Listing 4: Service Definition
01 define service{
02   use                  generic-service
03   host_name            centos4
04   service_description  IPMI
05   check_command        check_ipmi_sensor!/etc/ipmi-config/ipmi.cfg
06   }
Listing 5: IPMI User Data
01 username monitor
02 password ao5$snNc!
03 privilege-level user
Because of the configuration file, you don't need to store IPMI passwords in the Icinga configuration. Because no passwords are being transferred as parameters to ipmimonitoring, the access data are not shown in the process list. Additionally, this approach supports simple configuration of the additional ipmimonitoring parameters without modifying the plugin. The configuration file should only be readable for the icinga user for security reasons.
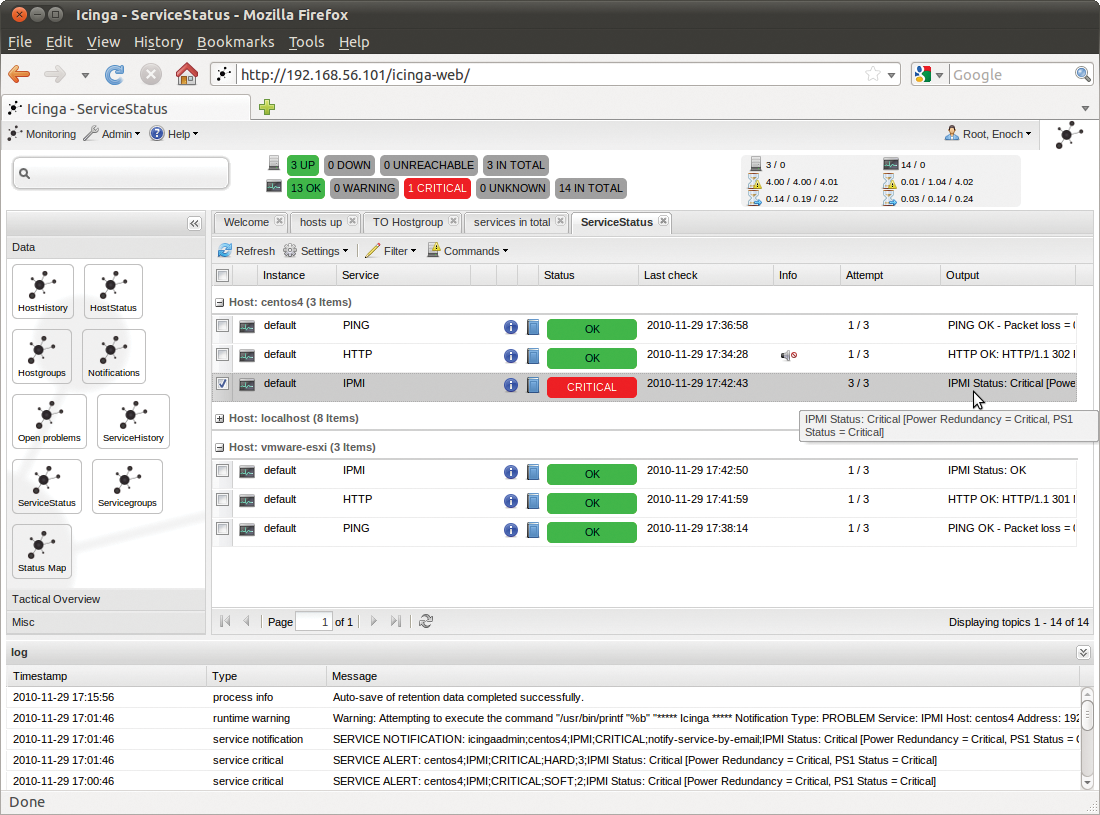
Icinga will now use the plugin to monitor all IPMI sensors on the server in question. If an error occurs, Icinga will post an alert: Issues with the power supply immediately trigger a Critical status (Figure 3). The output message IPMI Status: Critical Power Redundancy = Critical, PS1 Status = Critical indicates an issue with the first power supply. As specified by the Nagios Plugin Development Guidelines, the plugin supports three additional verbosity levels. The first gives you more detailed output – in this case, it would be: IPMI Status: Critical Power Redundancy = Critical ('Redundancy Lost' 'Non-redundant:Sufficient Resources from Redundant'), PS1 Status = Critical ('Presence detected' 'Power Supply input lost (AC/DC)').

On the basis of these details, you can see that power to the first power supply has failed, although the power supply itself has not reported an error. If the number of characters is too high for a text message, you can truncate the output, if needed. Verbosity Level 2 supplies multiline output. Level 3 provides comprehensive debugging information. The debugging information supplied with Level 3 can sometimes provide useful tips on potential configuration issues.
Performance Data
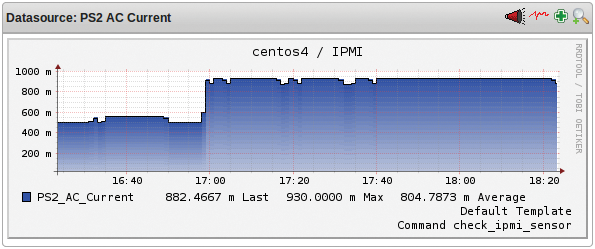
The IPMI plugin provides performance data for all numerical measurements. You can draw charts with this data via popular visualization tools such as PNP4Nagios. Figure 4 shows an increase in the power consumption of power supply 2 from 0.5 amp to approximately 1 amp after a failure of the main power to power supply 1 shortly before 5:00pm. PNP4Nagios can draw performance graphs for the other numerical values, such as fan speed, temperatures, or voltages, too.

Conclusions
The new IPMI Plugin v2 reliably monitors any IPMI sensor, whether threshold or discrete. In the case of a hardware issue, Icinga or Nagios immediately notifies the administrator. Whereas fan or power supply failures previously went undetected until the server failed, IPMI monitoring now supports fast troubleshooting.
The performance data provided add extra value: Previously, administrators would typically only monitor one temperature sensor per rack, but the IPMI plugin now monitors the temperatures of each individual server. This makes it possible to identify and resolve local cooling issues. With the use of the IPMI plugin, the availability of the complete server landscape can be drastically improved. Also, there are no constraints to the use of the plugin, which is open source and licensed under the GPLv3.
