I/O benchmarks with Fio
Disk Tuner
The maintainer of the Linux kernel block device layer, Jens Axboe, developed the Fio tool to measure performance in various applications. Simple benchmarks, such as hdparm or dd, have limits to their capabilities. They might test only sequential I/O, for example, which isn't particularly significant for normal workloads with many small files. On the other hand, writing a separate test program for each workload is pretty time-consuming.
The current version of Fio is 1.57. I have created a package for Debian that the Ubuntu developers integrated into Ubuntu. If you have SUSE versions since SLES 9 and openSUSE 11.3, the benchmark repository offers an up-to-date package [1]. Fio is also included with Fedora. The source code from the tarball or Git repository can be compiled with a simple make, assuming you have the libaio developer files in place. For Debian and its derivatives, this file would be libaio-dev; for RPM-based distributions, it's typically libaio-devel [2][3]. Fio also will run quite happily on BSD variants and Windows, as the documentation explains. An I/O workload comprises one or multiple jobs. Fio expects the job definitions as parameters at the command line or as job files in the ini format used by Windows and KDE.
The following simple call to Fio
fio --name=randomread --rw=randread --size=256m
sets up a job titled randomread and then executes the job. To allow this to happen, Fio creates a 256MB file in the current directory along with process for the job. This process reads complete file content in random order. Fio records the areas that have already been read and reads each area once only. While this is happening, the program measures the CPU load, the bandwidth created, the number of I/O operations per second, and the latency. Of course, a job file can be used for all of this:
[randomread]
rw=randread
size=256m
From this starting point, the workload can be extended to suit your needs. For example,
[global]
rw=randread
size=256m
[randomread1]
[randomread2]
defines two jobs that each read a 256MB file in random order. Alternatively, the numjobs=2 option does the same thing.
Fio runs all the jobs at the same time by default. The stonewall option tells Fio to wait until the jobs launched previously finish before continuing. The following
[global]
rw=randread
size=256m
[randomread]
[sequentialread]
stonewall
rw=read
tells Fio to perform a random read of the first file and then read the second file sequentially (Figure 1). The options in the global section apply to all jobs and can be modified for individual jobs. If you want to run two groups of two parallel jobs one after another, you need to insert the stonewall option for the third job. Before executing a job group, Fio discards the page cache, unless you set the invalidate=0 option.

While Fio is executing the workload, it tells you about the progress it is making:
Jobs: 1 (f=1): [rP] [64.7% done] [16948K /0K /s] [4137 /0 iops] [eta 00m:06s]
In the example, the first job is performing a sequential read, marked as r in square brackets, while Fio hasn't initialized the second job, marked as P. The letter R stands for a sequential read, w for a random write, W for a sequential write, and so on (see OUTPUTin the man page.). The program additionally shows you the progress with the current job group as a percentage, followed by the current read and write speeds, the current read and write IOPS, and the anticipated test duration.
After finishing all the jobs, the program displays the results. Besides the bandwidth and the IOPS, Fio also shows the CPU load and the number of context switches. The IO shows the distribution as a percentage, the number of I/O requests Fio had pending (IO depths), and how long it took to process them (lat for latency.)
Figure 1 shows the results of a test on a ThinkPad T520 with a 300GB Intel SSD 320 on kernel 3.0. When you are measuring performance, it makes sense to think about what you will be measuring up front and then to validate the results. The program uses a standard block size of 4KB, as you can see at the start of the output for the job groups. The 16,000 Kbps and 4,000 I/O operations per second (IOPS) for random reading are within a plausible range for an SSD (see Table 1 and "IOPS Reference Values" box). The results with 65,000 IOPS and 260 MBps for sequential read are quite obviously influenced by read ahead and the page cache.
Tabelle 1: IOPS Reference Values
|
Drive |
IOPS Reference Value |
|---|---|
|
SATA disk, 7200 RPM |
40 -100 |
|
SATA disk, 10000 RPM |
100 -150 |
|
SATA disk, 15000 RPM |
170 -220 |
|
SATA 300 SSD |
400-10000 |
|
PCIe SSD |
Up to one million |
A Plethora of Engines
The approach that Fio takes to performing the I/O operations depends on the I/O engine and the settings it uses. Figure 2 provides an overview of the many components involved here. Many applications read and write data by calling system functions with one or multiple processes and threads. The routines use or work around the page cache depending on the parameters.

A filesystem converts file access to block access, whereas low-level programs write directly to block devices (e.g., dd, the Linux kernel when swapping out to some kind of swap device, and applications configured to do so, such as various databases or the Diablo newsfeeder/reader) [7]. In the block layer, the active I/O scheduler passes the requests to the device drivers based on a set of rules. The controller finally addresses the device, which also has a more or less complex controller with its own firmware.
For performance measurement results, the question of whether requests are processed asynchronously or synchronously is important. The length of the request queue and the use or non-use of the page cache are also significant.
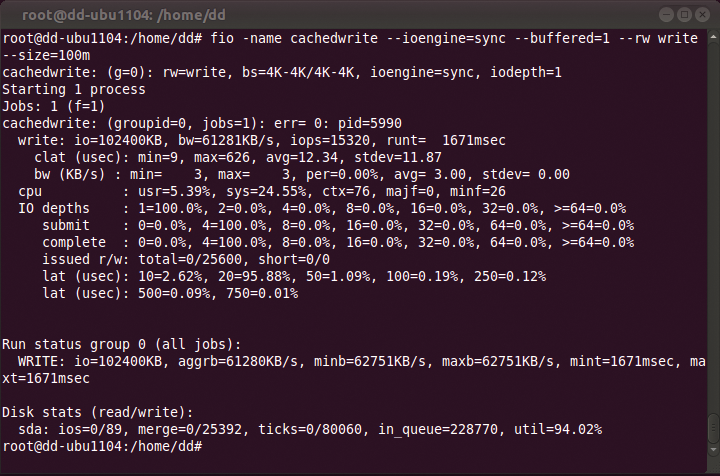
However, it is important to note that asynchronous and synchronous behavior, and queues, all exist both in the application layer and device layer. The sync I/O engine from the previous examples, which uses the read(), write(), and possibly lseek system calls, takes a synchronous approach at application level, as do psync and vsync. The function call doesn't return until the data has been read or posted to the page cache for writing. That explains why the queue length at application level is always one. This does not mean that the data has reached the device for writing (Figure 3) necessarily. The kernel collects the data in the page cache and then writes asynchronously at device level.

Synchronous engines also read synchronously at device level, unless multiple processes want to read simultaneously. But, this method is not as efficient as asynchronous I/O at the application level. If you want to work around the page cache and measure the device's performance directly, the direct=1 option will help you do so.
Synchronous, and thus unrealistically slow, performance at the device level can be enabled by setting the sync=1 flag, which is converted by most engines to using the open() with the O_SYNC flag. The system call doesn't return until the data are on the disk in this case.
The libaio, posixio, windowsaio, and solarisaio [8] engines work asynchronously at the application level. Asynchronous I/O involves the application issuing multiple requests without waiting for each individual request. It may continue with processing data it already received or with issuing further write requests while other requests are pending. The iodepth option checks how many pending requests Fio has at a maximum; iodepth_batch and iodepth_batch_complete discover how many requests the application sends simultaneously. However, this method only works with direct I/O on Linux, that is, by working around the page cache. Buffered I/O on Linux is always synchronous at application level. Additionally, direct I/O only works with a multiple of the sector size as the block size.
The job shown in Listing 1 results in far less bandwidth and IOPS for sequential reading – values that are far closer to the disk's actual capabilities (Figure 4). Because most applications take advantage of buffered I/O system, tests that involve the page cache definitely make sense. However, it is advisable to use a data volume that is at least twice the size of the RAM. It is also advisable to perform each measurement at least three times and to check for deviations.
Listing 1: Synchronous I/O
01 [global]
02 ioengine=sync
03 direct=1
04 rw=randread
05 size=256m
06 filename=testfile
07
08 [randomread]
09 [sequentialread]
10 stonewall
11 rw=read

Specifying the file name in the global area tells both tests to use the same file. Fio does not delete the files created by jobs. The program fills these files with zeros, which is typically okay for hard disks. But, if you have a filesystem or an SSD that uses compression, such as any SSDs with a more recent Sandforce chipset or Btrfs with the corresponding mount option, Fio will just measure how efficiently the compression algorithm can crunch zeroes.
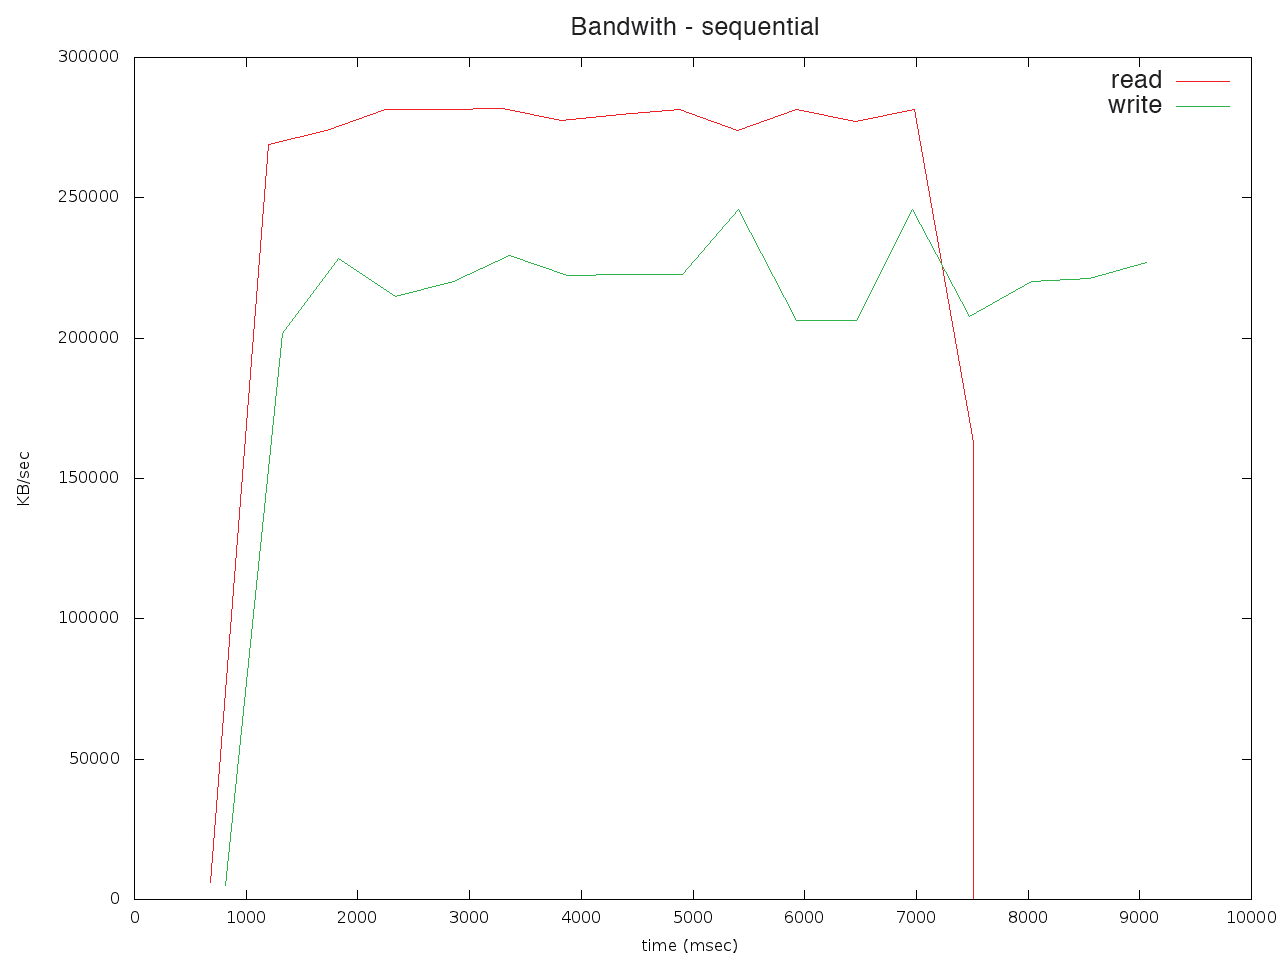
Random data can be achieved by creating a file with dd from /dev/urandom or by using Fio itself to write the file. The refill_buffers command tells Fio to fill the write buffer with new random data each time, rather than just once at the start (Listing 2). Setting the write_bw_log option tells Fio to log the sequential transfer rate for large blocks in write_bw.log or read_bw.log, unless you specify some other prefix. The fio_generate_plots script creates a plot (Figure 5) from the logs in the current directory. It expects a title as an argument – the current git version also accepts a resolution such as 1280 1024.
Listing 2: Filling the Buffer
01 [global]
02 ioengine=libaio
03 direct=1
04 filename=testfile
05 size=2g
06 bs=4m
07
08 refill_buffers=1
09
10 [write]
11 rw=write
12 write_bw_log
13
14 [read]
15 stonewall
16 rw=read
17 write_bw_log

This workload achieves 220 MBps with a write value of 54 IOPS, and approximately 280 MBps read performance at 68 IOPS. This performance is only slightly below the theoretical limit for an SATA 300 interface. Despite the promise of 20GB per day for a minimum of 5 years with an Intel SSD 320, you should be cautious with SSD write tests and take some of the load off the SSD with the fstrim command from a recent util-linux package [9].
The workload from Listing 3, which measures the IOPS with a variable block size between 2Kb and 16Kb, reuses a file created previously (Figure 6). But, this workload doesn't come close to the SSD's limits, as values of 68 or 67 percent for util show for the logical drive and the SSD itself. The load was 97 percent for the sequential workload. The SSD makes the 60-second maximum runtime deadline with a 2GB file in some tests.
Listing 3: Variable Block Sizes
01 [global]
02 ioengine=libaio
03 direct=1
04 # Run the job sequentially up front for random data
05 # over the complete length of the file
06 filename=testfile
07 size=2G
08 bsrange=2k-16k
09
10 refill_buffers=1
11
12 [randomread]
13 rw=randread
14 runtime=60
15
16 [sequentialread]
17 stonewall
18 rw=read
19 runtime=60
20
21 [randomwrite]
22 stonewall
23 rw=randwrite
24 runtime=60
25
26 [sequentialread]
27 stonewall
28 rw=write
29 runtime=60

A queue length of one also causes the libaio I/O engine to wait for each request before it completes the next one. This process does not place any load on the queue at device level. The SSD supports Native Command Queuing with up to 32 requests:
merkaba:~> hdparm -I /dev/sda | grep -i queue
        Queue depth: 32
           *    Native Command Queueing (NCQ)
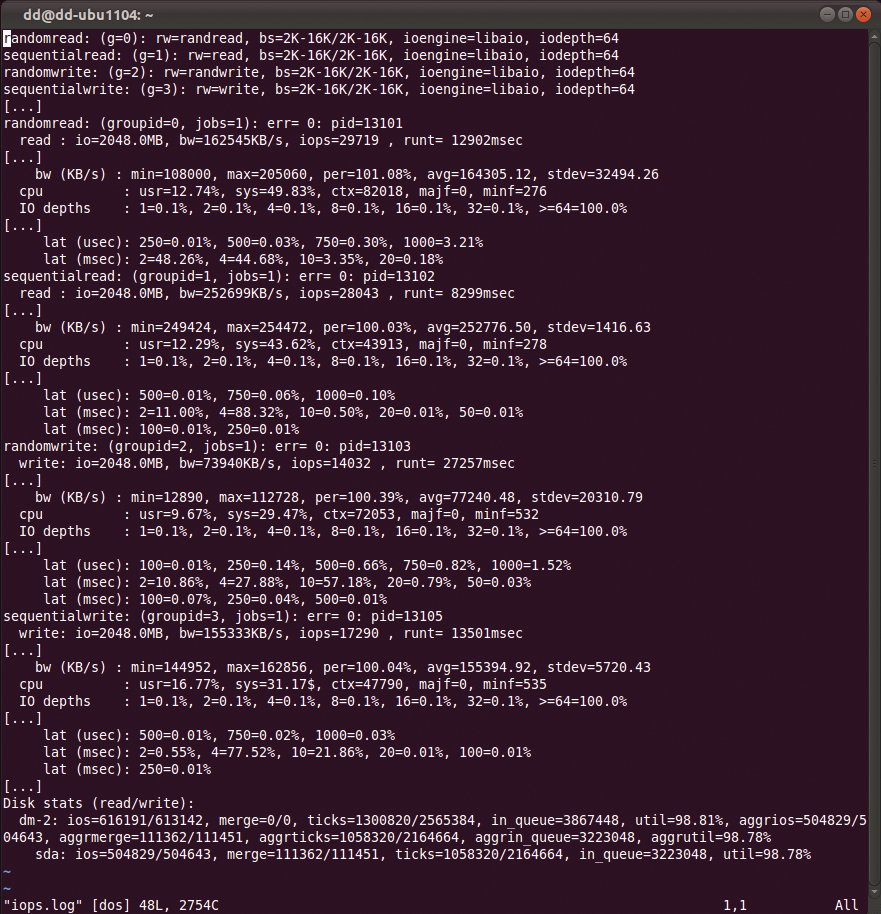
To keep a couple of additional requests pending, you could try twice the numbers. The iodepth=64 option boosts the performance considerably, as the kernel and SSD firmware have more scope for optimizations with longer queue lengths (Figure 7). However, the SSD also takes longer on average to respond to requests.

Because the kernel also keeps many requests pending with synchronous I/O at application level during buffered writing of large volumes of data or when multiple processes are reading and writing simultaneously at device level, you might want to test various queue lengths. An easy approach to this is to add iodepth=$IODEPTH to the job queue and to pass in the queue length as a variable to Fio.
Another possibility is to test many processes at the same time or perform a buffered write of a large volume of data. For example, a test with numjobs=64 also returns far higher values, which the group_reporting option collates per group. The --eta=never command-line option disables the very lengthy progress indicator.
High latencies caused by responding to user input – even on an Intel Sandy Bridge i5 dual core – and around 770,000 context switches show that this method creates more overhead. But, it still achieves read performance values of about 160 to 180 and 18,000 to 19,000 IOPS, as well as 110 MBps and 12,500 IOPS for write operations. The logs for this test can be downloaded from the ADMIN website.
Fio can do a lot more than that. The program also cooperates directly with the hardware as the sample job disk-zone-profile shows. The job outputs the read transfer rate across the whole scope of the disk. For low-level, realistic hard disk measurements, it is always a good idea to use the whole disk because the transfer rate for the outer sectors will be higher due to the larger circumference of the cylinder.
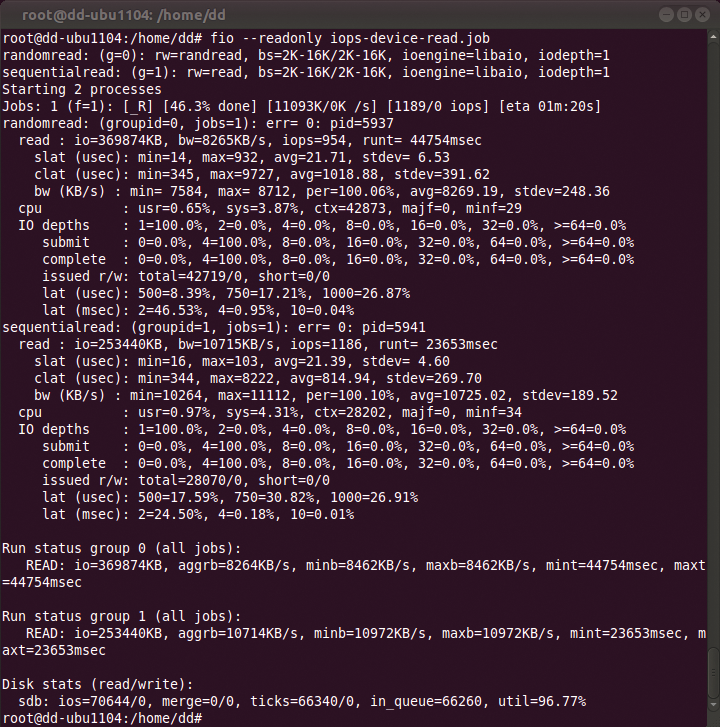
For example, a 2.5-inch Hitachi disk with a capacity of 500GB and an eSATA interface achieve a performance of approximately 50 IOPS (Figure 8) for a random read of 2 to 16KB blocks using iodepth=1. Alternatively, you can restrict tests and production workload to the start of the disk for higher performance. For read tests with disks that contain valuable data, the command-line option --readonly gives you additional safety.

Fio also uses the mmap engine to simulate workloads that load files into memory, while net with filename=host/port sends or receives data via TCP/IP, and cpuio uses CPU time. Additionally, the splice and netsplice engines use the Linux-specific splice() and vmsplice() kernel functions to avoid copying pages between user and kernel space (Zero Copy). The sendfile() function, which is used by the Apache web server, for example, relies on splice() to serve up static files more quickly.
Typical workloads with many buffered, asynchronous write operations and a definable number of calls to fsync can be simulated using the fsync, fdatasync, or sync_file_range options. Fio also supports mixed workloads with configurable weighting between read and write operations and between various block sizes. Check out the man page and the how-to for details of the entire feature scope.
Tuning
Performance tuning possibilities vary as much as those for workloads and test setups, and they have a similar effect on performance. As a general rule, use the defaults [10], unless you have a good reason to change them. Tweaking options typically doesn't add more than a couple of percent points to performance, and it can even reduce it. Despite this, I'll look at a couple of potential options.
Meaningful measures will always depend on how intelligent your storage devices are. An intelligent, self-buffering SAN system can reduce the level of intelligence used by Linux.
The I/O scheduler noop, which may also be useful for SSDs, can prevent the kernel from re-sorting requests in a way that may not match the SAN system's algorithms (see the /sys/block/device/queue directory). For read-ahead on a SAN, it may be useful to reduce the Linux-side read-ahead using blockdev -setra while, at the same time, increasing the queue length to the SAN find /sys -name ("*queue_depth*") assuming that the SAN can handle the accumulated queues from all your clients.
It makes sense to align partitions and filesystems on SANs, RAIDs, SSDs, and disks that all use data blocks larger than 512 bytes with 4KB sectors. This approach can achieve speed benefits in double figures. Newer versions of fdisk with the -c option automatically align on 1MB borders. This default is useful, because it is divisible by the typical values of 4, 64, 128, and 512 KB. The mdadm option uses a chunk size of 512 KB; earlier versions and hardware RAIDs often use 64 KB. Popular filesystems like Ext3, Ext4 and XFS [10] support corresponding parameters in their mkfs and mount options.
For filesystems, you could say that the default values of current mkfs versions often achieve the best results. Completely disabling Atime updates with the noatime mount option can noticeably reduce write operations compared with relatime [11].
Conclusions
This article shows the importance of considering the intended workload when testing performance. Details on IOPS are relative to the test setup and workload. The test scenarios described here are designed for reading and writing data. Even though Fio uses multiple files with the nrfiles option, other benchmarks, such as bonnie++ or compilebench, may be preferable for metadata-intensive workloads.
