Windows Performance Toolkit and System State Analyzer
Tuner
The free Windows Performance Toolkit helps administrators troubleshoot performance bottlenecks, startup issues, and slow application performance. It also investigates boot time delays. Experienced users and developers will discover that the toolkit also provides options for measuring application resources and interrupts. The new version of the toolkit is optimized for use with Windows Server 2008/2008 R2 and Windows Vista/7, although it can also be used with Windows Server 2003 R2 or XP SP3.
In contrast to Windows' own performance monitor, the tool doesn't work with indicators that you have to launch separately but uses integrated measuring points. In addition to this tool, you can also deploy the free Windows System State Analyzer to precisely investigate changes to your system.
The two tools support efficient monitoring and analysis of servers, which also can help developers understand the effects that their programs have on a Windows server. The two tools create exportable log files and are thus both suitable for troubleshooting. To allow this to happen, you just perform the measurements and send the log files to a specialist who then analyzes the errors. This process can also be seen as an attempt by Microsoft support to solve customer performance problems.
Windows Performance Toolkit
The Windows Performance Toolkit belongs to the Windows Software Development Toolkit (SDK), which you can download for free [1]. To run the tools, you will need .NET Framework 4 [2]. If you want to investigate Windows 7 or Windows Server 2008 R2 with the tool, you will need Windows Performance Toolkit 4.7, which is part of Windows Software Development Toolkit 7.1.
You don't need to install the complete SDK on a server; instead you can simply launch the installation from the Setup\ WinSDKPerformanceToolKit_amd64 (64 bit) WinSDKPerformanceToolKit (32 bit) directory. The installation wizard prompts you to confirm a few things, and there's no need for configuration. The tool does not install any drivers or permanently active background processes, although the traces themselves will run in the background after you launch them.
Xperf, Xperfview, and Xbootmgr
The Windows Performance Toolkit mainly comprises three tools: Xperf, Xperfview, and Xbootmgr. To begin taking performance measurements, it is a good idea to run the Xperf command-line tool first, passing in various options when you do so. During the analysis, the tool saves the trace file, which you can analyze later using Xperfview. The analysis itself takes place in a graphical user environment that offers very good filtering options and zoom levels.
Xbootmgr lets you investigate your computer's boot process or the corresponding processes after a standby or sleep mode. Microsoft has also published a comprehensive white paper [3] on this subject. To perform measurements, however, you don't need to battle your way through hundreds of pages of information; instead, you will be able to produce measurement results shortly after the installation.
After installing Windows Performance Toolkit, you can launch a simple system analysis as follows:
- Launch a prompt with administrative privileges.
- Enter the command
xperf -start -on diageasy. Alternatively, you can typexperf -on diageasy. - The tool then runs in the background and measures the system performance.
- Launch the programs and tools whose performance you want to measure. In the background, the tool measures the computer's response times.
- After completing all of the tasks that you wanted to measure in your analysis, type the command
xperf -stopto stop the measurement. You can also stop the measurement by typingxperf -d trace.etl; this stores all your trace data in thetrace.etlfile.
You then see a message that Windows Performance Toolkit has created the trace file called C:\kernel.etl. If you stop the trace by typing xperf -d trace.etl, you will have a file named trace.etl. To open this file, enter xperf trace.etl. If, for example, Windows 7 responds too slowly when started, you can start various traces.
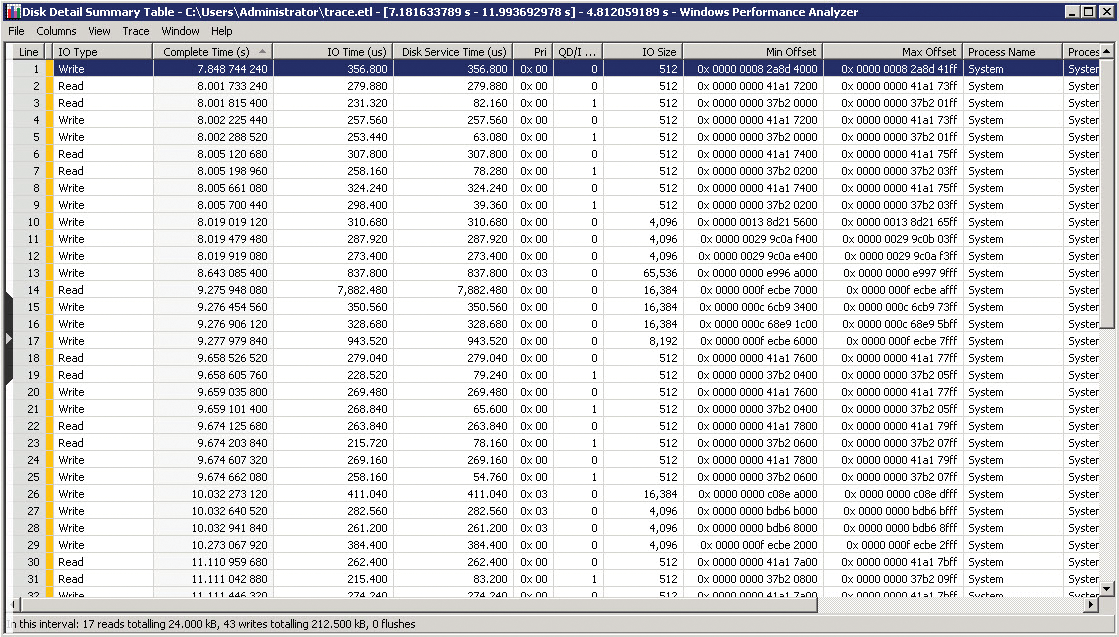
The xperf -on -f kernel.etl option launches the trace for the basic Windows start. You can then type xperf -start UserTrace -on Microsoft-Windows-Win32k -f user.etl to trigger a procedure parallel to the first for the login and for measuring user actions. Then, launch the troublesome application and stop the traces by typing xperf -stop UserTrace and xperf -stop. You can also merge the two ETL files that you saved. To do so, run the xperf -merge user.etl kernel.etl Newfile.etl command. Then, you can analyze the file to discover why the computer is responding so slowly (Figure 1).

If you additionally want to analyze the boot process and its related sequences, Xbootmgr will be your tool of choice. To begin, type xbootmgr -trace boot -resultpath c:\temp at the command line. The tool then reboots the computer and measures the boot process.
Again, the tool stores an ETL file directly in the C:\temp path. You can freely choose the path. Once the boot sequence is complete, you will be able to access the ETL files for analysis. The following examples create meaningful analyses:
- Extended boot:
xbootmgr -trace boot -traceFlags BASE+CSWITCH+DRIVERS+POWER -resultPath C:\temp - Shutdown:
xbootmgr -trace shutdown -traceFlags BASE+CSWITCH+DRIVERS+POWER -resultPath C:\temp - Standby:
xbootmgr -trace standby -traceFlags BASE+CSWITCH+DRIVERS+POWER -resultPath C:\temp - Start after hibernation:
xbootmgr -trace hibernate -traceFlags BASE+CSWITCH+DRIVERS+POWER -resultPath C:\temp
Various other options exist for measuring the boot process, depending on the environment you want to test.
Extended Analyses with Xperf
Besides simple standard analysis, Xperf.exe also provides options for extended measurements. You can display all of the tools advanced options by typing xperf -help start. To discover how you terminate the trace and which options the Windows Performance Toolkit offers you when you do so, type xperf -help stop. Developers and experienced administrators will also appreciate the option of displaying the list of kernel flags used by the tool by typing xperf -providers k.
The first step in any measurement will always be the xperf -start -on diageasy command. This action creates a kernel.etl file. If you want to determine the name and path of the trace file yourself, set the option -f filename.
Evaluating Trace Files
You can open any files you create with the Windows Performance Analyzer, which is located in the "Windows Performance Toolkit" program group. To display the measurements, open the C:\kernel.etl file, or the ETL boot file using File | Open. The trace files are transportable: in other words, you can analyze the files with Xperfview on another machine after creating traces with Xperf or Xbootmgr. You might see an error message on opening a file. If so, open a prompt with administrative privileges and type xperfview file -tti.
You can filter the display of various areas in the menu, which you can see by clicking the left part of the window. To do so, click the icon on the left edge of the window at the center. Various measurement areas are available and can be viewed here. If you uncheck the checkbox, the diagram disappears from the viewer.The view is dynamic; you can hide diagrams that are on view, and vice versa, which allows you to view precisely the data that you currently want to analyze. For example, if you are measuring the boot sequence and only view CPU Usage by Process, you can see exactly how much CPU load the individual processes are causing. Disk I/O shows you hard disk access.
If you click on the graphic in the diagram, you can zoom in to parts of the view. To do so, select the area you want to enlarge with the mouse and then right-click. The Zoom to Selection menu item starts the zoom. Besides graphics, you can also create tables by selecting the Summary Table option in the drop-down menu. The table displays information for the trace period in a style similar to the TaskManager. Using this approach, you can quickly see which processes have placed the greatest load on the CPU during the trace period.
You can sort the view by clicking on the corresponding column in the table. If you select various lines on the table, you can use the drop-down menu and select Export Selection to export the data into a CSV file, which you can then process with Excel.
Another performance measurement tool is quite interesting in this context. If you are doing a lot of troubleshooting and analyzing, it is not always sufficient to parse the real-time data in a task manager or some other tool. The Excel Taskmanager.xls spreadsheet from [4] can be a useful aid here. After opening the table in Excel, you can easily import the current processes and their data from TaskManager. You can then import the CSV files from the Windows Performance Toolkit into the table for comparison purposes (Figure 2).

Another analysis option allows you to superimpose diagrams in the viewer window. To do so, right-click the diagram that you want to superimpose. In the drop-down menu, select the Overlay Graph and then select the graph you want to add. You could use this approach to integrate the hard disk performance graph with the CPU load graph, for example.
If you need more detailed information, you can use the drop-down menu in the Disk I/O or Disk Utilization graphs to select the Detail Graph option. This option shows you the read and write access during the trace, which will help you understand which hard disk actions are currently stressing your disk.
Other add-on tools available from Microsoft will help you monitor hard disk usage in addition to Windows Performance Toolkit. In most cases, using additional tools in parallel provides a more revealing analysis of the trace results.
Hard Disk Activity
The free Diskmon tool from Microsoft Sysinternals [5] shows you all read and write access for a hard disk in real time in a separate window. The tool can be launched directly without needing an install. It shows you the access and current disk activity including the action, sector, time, duration, and the hard disk to which the computer is currently writing. You also have the option of storing the output directly in a logfile.
If you enable the Minimize to Tray Disk Light function in the Options menu, the tool slots into the system tray and continues to display the current hard disk usage, thus giving you visibility of hard disk access in real time. In the minimized view, the tool displays write access in red and read access in green. If you click the icon, the detailed view appears again. If you prefer to launch the tool as an icon, use the diskmon /l command. To allow the tool to read events, you must run it with administrative privileges, assuming you have enabled user account control.
Windows Server 2008 R2 and Windows 7 hide the icon after some time. To display it permanently, click the two arrows in the taskbar to display the hidden icons. Select Customize | Show icon and notifications. To disable the real-time display, click the small magnifying glass. Some description for the buttons is available on mouse over.
In the capture window, you can also search for specific entries. History Depth defines the maximum number of records you want to view in the GUI. Diskmon also lets you launch multiple instances to monitoring various hard disks on the system. If you automatically start the tool as an LED, you can launch another instance parallel to keep the LED active while you are working with Diskmon.
System Information
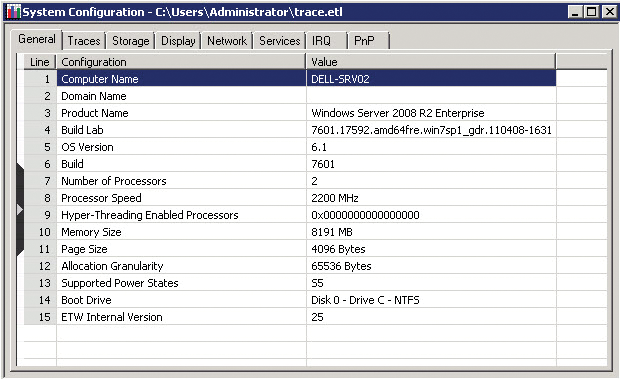
If you run a trace against multiple servers using Windows Performance Toolkit, it is interesting to know what the system configuration of the computer you are investigating looks like, and obviously to know which computer the trace file belongs to. Windows Performance Toolkit stores this information in the ETL file. In the viewer, you can click Trace | System Configuration to open a new window with exhaustive information on the computer.
The window shows you the computer name, the domain, the installed operating system, the version, the CPU speed, and the RAM size (Figure 3). Various tabs provide more information and compare well with third-party system analysis tools. Again, you can select and right-click to export data to CSV files. The Traces tab shows you exactly when you performed the trace.

You can update the system configuration at the command line using the xperf -i trace.etl -a sysconfig command. The systeminfo command lists server information at the prompt, including information on hotfixes, network cards, the CPU, the operating system, the vendor, and so on – even the current system uptime, and the original installation date. You might want to pipe this information into a text file and add the /FO list parameter to store the information in a useful format. To store a full set of information in the C:\sysinfo.txt text file, enter the systeminfo /FO list > C:\sysinfo.txt command. You can use this file for analysis with the Windows Performance Toolkit ETL file.
Windows System State Analyzer
Performance issues on computers often occur after installing applications or drivers. Again, Microsoft offers a tool that can help you identify the source of the problem. When you install an application on a computer, many changes to system files, directories, and the registry typically occur. The result of these changes can be slow system performance. Windows System State Analyzer (WSSA) belongs to the Software Certification Toolkit and is available in 32-bit and 64-bit versions [6] [7].
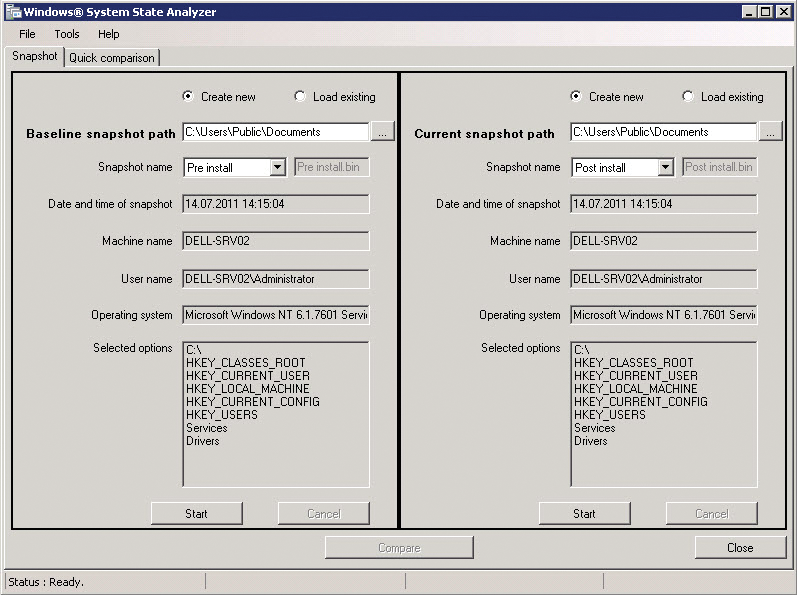
Before you can use the tool for test purposes, you first need to create a snapshot; then you can install the application and create another snapshot. You can then compare the two snapshots with the following steps:
- Launch Windows System State Analyzer.
- Enable the Snapshot tab.
- Keep the Create New option.
- Define the path in which Windows will store the snapshot.
- Click Start.
The tool creates a snapshot of the current system status, which can take a couple of minutes. You will see the status in the lower part of the window. Then, install the application whose changes you want to monitor. Keep WSSA running, and don't make any other changes to avoid spoiling the results.
After installing the application, click the Create New option on the right of the tool. Again, select a path. This process gives you two snapshots, and you can compare the changes. To do so, click Compare at the bottom of the window. The tool starts to compare the two snapshots and shows the changes the installation process made. The tool pops up a new window and displays the changes organized by filesystem, registry, services, and drivers (Figure 4).

Boot Time
Besides performance measurement with additional tools, Windows 7 also has internal options for performing minor measurements. If you tune Windows 7, you might like to know what effect they have on the system boot.
The operating system shows the time that Windows needs to boot the operating system in the event manager. You can display this in the event viewer as follows:
- Type
eventvwrin the start menu search box. - Navigate to Applications and Services Logs | Microsoft | Windows | Diagnostics-Performance | Operational.
- Events with an ID of 100 show the boot duration; events with an ID of 200 show the shutdown duration.
Windows Server 2008 R2 doesn't have this diagnostics option. If you enter reliability in the start menu search box, Windows 7 creates a report detailing errors and information relating to the operating system. You are also shown a system performance index and can click to view additional details.
Again, this is a potential approach for viewing changes, which you can use in combination with the other diagnostics tools discussed in this article to discover why the system in question didn't perform as expected at any given time.
