Performance monitoring in Windows Server 2008 R2
Tune-Up
The Performance Monitor in Windows Server 2008 R2 is a powerful tool for identifying performance issues. Compared with the previous version, very little has changed in terms of control. The tool is available in the Server Manager below Diagnostics | Perf | Monitoring Tools | Performance Monitor. However, you might prefer to take the shortcut and type perfmon.msc in the Start menu search box. Typing perfmon /res launches the Resource Monitor, which gives you the current resource use in real time, as in the Task Manager.
Exchange and Active Directory
When performance problems occur in Exchange or other services that depend on Active Directory (e.g., when accessing mailboxes or sending messages), often they are caused by a problem in Active Directory or DNS. Thus, you will want to run diagnostics for name resolution and your domain controllers parallel to performance monitoring – for example, using dcdiag.exe for Exchange. But, other services that require the Windows directory service use the wldap32.dll system files to access Active Directory. The following simplified processes occur:
- The
wldap32.dllfile on the Exchange server receives a request to access the global catalog from the Exchange process. - The server uses DNS to resolve the global catalog server and thus access it. If this takes too long, access to Active Directory is delayed as early as this point.
- Following name resolution,
wldap32.dllopens a connection to the global catalog and transfers the request. - A TCP connection is established and an LDAP request is issued. For this connection to work, the TCP connection needs three acknowledgements from the domain controller. Assuming a latency of 10ms on the network, the access attempts will take 30ms before the Exchange server can transfer the LDAP request.
- On the domain controller, the LDAP request is accepted by
lsass.exe, which listens for connections on the server's LDAP port. - The domain controller accepts the request for the global catalog and performs a search in its own global catalog.
- The global catalog sends the data through the network adapter to the
wldap32.dllfile on the Exchange server. If the data volume is high (e.g., if you need to resolve the members in the distribution group), all of the data must be transferred before Exchange can continue processing.
Much of the server's performance depends on the speed of the network connection between the Exchange server and the global catalog domain controller. For this reason, you should always measure the network speed if you experience performance problems in the Exchange infrastructure. Fast connection to the DNS server and prompt, stable, and correct name resolution are also important. If the requests take too long to complete, you've identified the first Exchange performance bottleneck. You don't even need the Performance Monitor to do this: just ping the server.
The freeware Performance Analysis of Logs (PAL) tool is very useful for evaluating performance logs. Along with the tool, the website [1] also offers help and documentation on the topic of server performance monitoring. If you manage a complex structure, it's good idea to read the guides on this site. To run the tool, you also need Log Parser 2.2 [2], which is also free, and the Office Web Components add-on for Office 2003 [3]. You need to install these tools on your server before installing PAL.
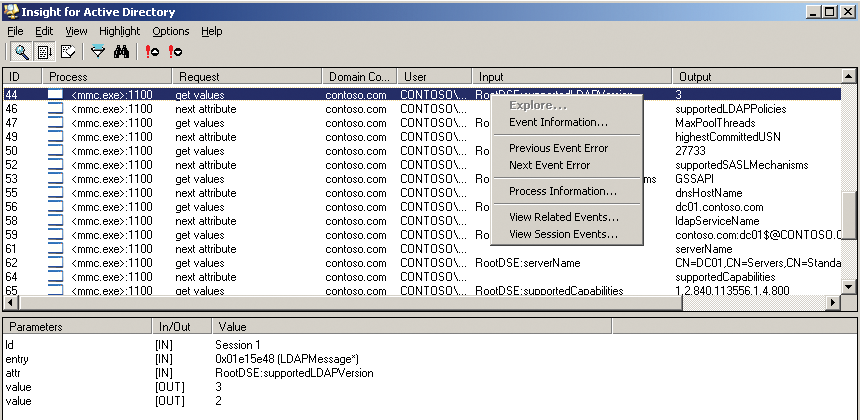
Insight for Active Directory, ADInsight, lets you monitor LDAP connections on a domain controller in real time on a GUI (Figure 1). As one of Microsoft's Sysinternal tools, it is also for download [4]. Use of the tool is similar to two other Sysinternal tools: Regmon and Filemon.

ADInsight investigates all calls to the wldap32.dll file and displays all requests, including blocked requests, providing a way to analyze authentication problems with Active Directory-dependent programs and discover which clients and servers open connections to the domain controllers.
In addition to latency and server resources, authentication issues can be the cause of performance problems. Requests to the domain controller are logged in ADInsight and stored in HTML or text format for troubleshooting purposes. The protocol contains the client request and the response the client received via LDAP. ADInsight also logs system service access. The tool comes with a file that supports users with comprehensive analysis options. When programs like Exchange access the domain controller, the window fills with information. To view additional information relating to the individual entries, just right-click. You can also filter the display via the menu.
The display includes the username of the user seeking access. ADInsight lets you monitor local access, but it doesn't support diagnostics across the network by remote access. However, you can filter specific processes, errors, or request results. The tool selects the results so that you can perform targeted monitoring. ADInsight can also be automated and provides various automation options. The ability to write protocols to a file without displaying actions in the graphical interface is useful in automated monitoring. The tool runs on Windows 2000 Server and newer.
Measuring LDAP Read Access
To check the performance of Active Directory-dependent services, such as Exchange, as they interact with the directory service, you need the performance data for accessing Active Directory information via LDAP. If the Active Directory connection is slow, Exchange will also react slowly. If you have ruled out name resolution, Active Directory, and authentication problems in the previous steps, you can use the Performance Monitor to further isolate the problem.
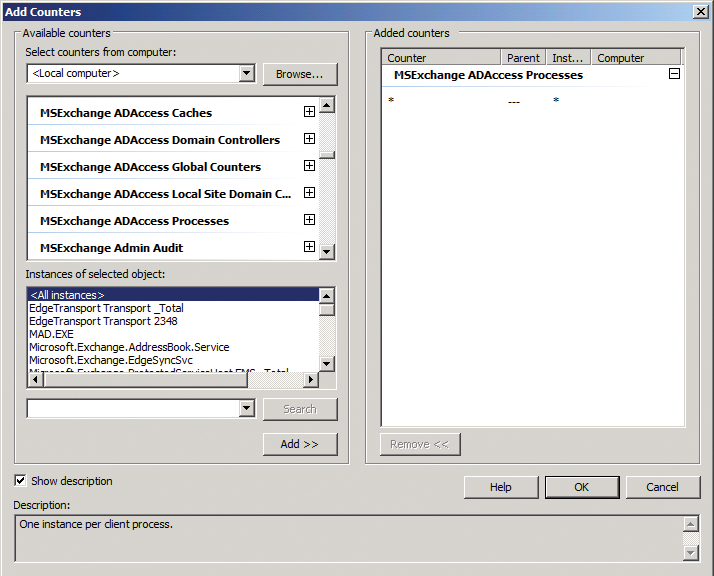
The first step in performance monitoring is thus to run Performance Monitor on the Exchange server; you can launch it by typing perfmon.msc. Then, click on Performance Monitoring. Click on the green plus sign to create a new counter. If you want to monitor the server's various resources, start by selecting the corresponding counter and then click Add (Figure 2). You can view a description of the counter group currently selected in the list by checking Show description in the left corner of the window. To display the counter, click on the down arrow next to the group name. To add a group of counters, select the group name and press the Add button. If you select a counter on the list before pressing Add, you only add that one counter. If you want to select multiple counters in a group, hold down the Ctrl key and click on the names on the list.

Once you have selected the desired counters, click Add. If you only want to add a specific instance of the counter, select a group name in the list, select the desired process in the list below Instances of selected object, and then click Add. When you select an instance, Performance Monitor only logs the counters created by the selected process. If you don't select an instance, Performance Monitor will monitor all of the instances – for example, all processors. Thus, you can monitor individual web applications on the server, for example, but also all processors or all processor cores.
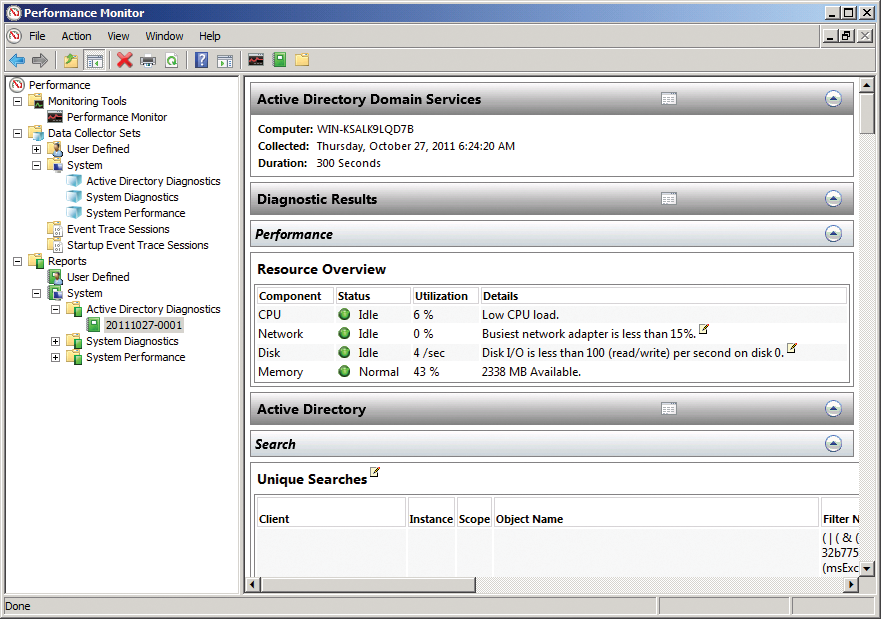
The counter group that is important for the connection between Exchange and Active Directory it the MSExchange ADAccess Processes group. The Exchange installation wizard adds this to a server. The interesting counters in this group are LDAP read time and LDAP search time. After pressing the plus sign next to the counter group in the top area and clicking on the two counters, in the lower area, select All instances and then click Add. LDAP read time measures the time that an LDAP request requires to transfer data. LDAP search time shows the time the server needs to perform a search using LDAP in Active Directory. The average value of these counters should be less than 50ms; the maximum generation should not be more than 100ms. To toggle the display between a line, a histogram bar, and the report, use the Performance Monitor tool bar (Figure 3). This makes it easier to get an overview if a specific server is having difficulty connecting with Active Directory.

Monitoring LDAP Access to Domain Controllers
To allow Active Directory-dependent services to retrieve data from Active Directory quickly and efficiently, the global catalog response must be fast and must not be overloaded. To check the load, again use Performance Monitor by clicking on Data Collector Sets | System | Active Directory Diagnostics, and then on the green triangle in the toolbar to start the collector set.
While the server is measuring the data, try to query Active Directory to see whether the issue lies with the global catalog. Once the query completes, you can stop the collector set by pressing the Stop button. If the server is having performance problems, you can simply start the collector set and allow it to measure requests for a while. After some time, you can stop the measurement using either the collector set's drop-down menu or the toolbar. Then, you can go to Reports | System | Active Directory Diagnostics to view the data for the previous measurement. You will see all the tasks performed in the various areas along with the data and the access speeds.
The important thing in this report is the Active Directory section. In the report, click on the small arrow on the right-hand side and select the Search option. This takes you to a new page where you can view the details of the data connections as well as the transactions. On the right-hand side, you can see the response times and the transfer data. You should not see any peaks in this area. The shorter the response times, the quicker the server reacts. If you then right-click the report, you can select View | Folder to view the contents of the report. In the folder view, you can choose between an HTML file and an XML file containing the records data. The data can be exported for use in other programs, such as the PAL freeware tool mentioned previously.
Resolving Memory Bottlenecks
Performance problems can have a number of very different causes. Another problem in performance analysis is that removing one bottleneck often takes you straight to the next bottleneck. For example, if you have more memory, you often discover next that the processor has reached its capacity limits.
A number of basic rules exist for the use of memory. The first rule is: Having a lot helps a lot, both in terms of main memory and cache. This rule is more true of Windows Server 2008 R2 than it ever was with Windows Server 2003/2008. The second rule is: It's preferable to put the swap file on a different physical hard disk than on the system partition. The price you pay for doing so is that you will not have any memory dumps in case of system errors.
Experts can use memory dumps to trace errors in the operating system. However, these options are rarely used today because simpler troubleshooting tools are available. The swap file is also an area that is very important in terms of memory management. Windows Server 2008 R2 swaps out information from physical memory to the swap file if it doesn't have enough physical memory or if processes don't need their data on a permanent basis. Although the server can swap out virtually any amount of memory if you have enough free disk space, you quickly reach a point at which swapping is simply too slow. Thus, monitoring swapping plays an important role in analysis.
To prevent writes to the swap file from being slowed by writes to the hard disk, it's a good idea to move the swap file onto a different physical hard disk in the server. If you don't have a second physical hard disk, moving the swap file doesn't make any sense at all, because moving the swap file to a partition that resides on the same physical disk doesn't achieve any positive results.
Remember that the size of the swap file can be approximately two and a half times that of the actual RAM size. This measure prevents fragmentation of the file because Windows doesn't need to change the size of the file permanently.
The settings for the swap file are located in Start | Control Panel | System and Security | System | Advanced System Settings. To change the size of the swap file, click the Advanced tab and then go to Performance | Settings | Advanced | Virtual Memory | Change. Next, uncheck the Automatically manage paging file size for all drives box, then enable the option Custom size if you want to define the size of the file yourself.
For Initial size and Maximum size, type a value that is approximately two and a half times the RAM size. This ensures that the file will not be fragmented. Then, reduce the size of the swap file for drive C: to 0. Click on Set to store the changes, close any open windows, and reboot your server.
On a core server, the best approach to moving the swap file is to use following command:
Wmic pagefileset where name="path"
 set InitialSize=initialsize,
MaximumSize=maximumsize
Make sure that you terminate automatic configuration with the following command beforehand:
wmic computersystem where name="Hostname"
set AutomaticManagedPagefile=False.
Some interesting notes on this process are available from TechNet [5]. The most obvious consequence of lack of memory is that administrators will tend to install more RAM in the server. Unfortunately, this approach isn't always the most helpful. Whatever else you do, you should always discover which processes are responsible for excessive use of memory. To do so, use the Process object in Performance Monitor.
Processor Load
Processor load can be a bottleneck, too. Not having enough RAM can mean the processor is exposed to extremely heavy load. Swapping out pages and processes causes a huge amount of work for the CPU. After all, it bears the brunt of memory management. Because resolving a lack of main memory is typically cheaper than upgrading a processor, it makes sense to investigate the situation upfront. CPU load isn't a problem if it is only short term or only occasionally rises above 90 percent. It does become a problem if the values stay in this range over an extended period of time.
On multiprocessor systems, you should watch the performance counters in the System object. Windows uses these counters to collect information from several system components, so you can ascertain the load on all of your processors. Additionally, the Processor time counters belonging to the Processor objects are significant. If you have many different processes running, a uniform load distribution is almost certain. In the case of a single process, spreading the load over several threads of more or less same weight is important.
The thread is a process execution unit. If a process uses multiple threads, they can run on different processors. The load is distributed by the system according to the load on the individual processors. A large number of queues means that multiple threads are ready to compute; however, the system hasn't assigned any computational time to them. The rule of thumb is that this value shouldn't be more than 2, if possible. If the average processor load is relatively light, this value doesn't play a significant role.
When you are measuring the performance of the server, the main points to consider monitoring are the processor, RAM, network speed, and Active Directory response times. In the case of virtual servers that you run with Hyper-V on Windows Server 2008 R2, you will definitely want to install Service Pack 1 for Windows Server 2008 R2 and enable dynamic memory.
Dynamic memory allows for dynamic memory allocation between virtual servers. You can set a minimum and a maximum value for the RAM usage of your virtual machines, and you can weight the servers so Hyper-V can decide which server is allocated what amount of RAM. The benefit is dynamically available RAM, so servers that require more RAM for a short time are assigned this automatically by Hyper-V. Other servers that don't need all of their RAM allocation all of the time donate to the pool.
If these performance monitoring options are not sufficient, Microsoft offers solutions such as the free Microsoft Windows Performance Toolkit to measure system performance in a very efficient way. For more information, check out my article in the previous issue of Admin magazine [6].
