Intruder detection with tcpdump
Sniff Test
Tcpdump is a widely used and powerful tool that captures, parses, and analyzes network traffic. Created by the Network Research Group at Lawrence Berkeley National Laboratory in Berkeley, California, tcpdump [1] is deployed with libpcap (a C/C++ library for network traffic capture) and maintained by the libpcap developers. With tcpdump, you can analyze large binary files that are too large to view casually with a tool like Wireshark by whittling your file down to only the information pertinent to your investigation. Most distributions have tcpdump installed by default; if yours does not, use your distro's package manager. SourceForge [2] has project information as well as the code.
Tcpdump runs locally on your machine and can read or write network traffic information to a file. A basic capture uses the syntax
tcpdump -n -I <interface> -s <snaplen>
where -n means tcpdump should not resolve IP addresses to domain names or port numbers to service names, -I <interface> is the interface to use, and -s specifies how much of the packet to record – I use 1515, which is usually sufficient. If you do not specify a size, it will only capture the first 68 bytes of each packet. Except in older versions of tcpdump, a snaplen value of 0 uses a length needed to capture whole packets. Figure 1 dissects the output of a sample dump, and Table 1 shows other tcpdump options.

Tabelle 1: Tcpdump Capture Options
|
Option |
Description |
|
|
Specify an interface to ensure you are sniffing where you expect to sniff. |
|
|
Do not resolve IP addresses to domain names or port numbers to service names. |
|
|
Don't resolve hostnames or port names. |
|
|
Show packet's content in both hex and ASCII. |
|
|
Include Ethernet header. |
|
|
Increase verbose level; |
|
|
Only get x number of packets and stop. |
|
|
Tell tcpdump how much of the packet to record. |
|
|
Print absolute sequence numbers. |
|
|
Get Ethernet header. |
|
|
Show less protocol information. |
|
|
Decrypt IPsec traffic with an encryption key. |
File Read and Write
Tcpdump lets you to write to a file with the -w option and read from a file with the -r option:
$ sudo tcpdump -i wlan0 -w dumpfile001
$ sudo tcpdump -r dumpfile.pcap
If you want to see the files as they are captured and save them to a file, use:
tcpdump -n -I eth1 -s 1515 -l | tee output.txt
This command tells tcpdump to line-buffer its output, and by piping to the tee utility, it sends output to the screen and output.txt simultaneously, but not in binary format. The best way to do that is run a second instance of tcpdump.
Timestamps
When tcpdump captures packets in libpcap format, it adds a timestamp entry to the record in each packet in the capture file. Software like tcpdump uses libpcap to capture packets traveling over a network, read saved capture files, and analyze them. You can augment that data with the -tttt flag, which adds a date to the timestamp (Figure 2). If you don't understand the time differences reported and need to be absolutely sure of time, use the -tt option to show seconds and microseconds since the beginning of the Unix epoch (Figure 3). The useful expressions shown in Table 2 can help you cut down the amount of traffic.


Tabelle 2: Useful Syntax
|
Expression |
Function |
Examples |
|---|---|---|
|
|
Capture traffic on a block of IPs (e.g., 192.168.0.0/24). |
# tcpdump net 192.168.1.1/24 |
|
|
Only capture packets from a source or destination. |
# tcpdump src 192.168.100.234# tcpdump dst 10.10.24.56 |
|
|
Capture only traffic based on the IP address. |
# tcpdump host 10.10.253.34 |
|
|
Capture for TCP, UDP, and ICMP. (Note that you don't have to type |
# tcpdump tcp |
|
|
Capture packets coming from or going to a port or a range of ports. |
# tcpdump port 21# tcpdump port 20-25 |
|
AND ( |
Combine expressions |
# tcpdump -n -I eth1 host 10.10.253.34 and host 10.10.33.10# tcpdump -n -I eht1 src net 10.10.253.0/24 and dst net 10.10.33.0/24 or 192.5.5.241# tcpdump -n -I eth1 src net 10.10.30.0/24 and not icmp |
Packet Information
To find information in the packet, you need to know where to look. Tcpdump starts counting bytes of header information at byte 0; the 13th byte contains the TCP flags shown in Figure 4. Looking at byte 13, if SYN and ACK are set, then your binary value would be 00010010, which is the same as decimal 18. To search for packets with this type of data in byte 13, use:

# tcpdump -n -r dumpfile.lpc -c 10 'tcp[13] == 18' and host 172.16.183.2
Figure 5 is an example what this command returns. When capturing data with tcpdump, you can ignore ARP traffic by using a filter:

# tcpdump -n -s 1515 -c 5 -I eth1 tcp or udp or icmp
This will catch only tcp, udp, or icmp.
Tables 3 and 4 show how to find all TCP packets with the SYN ACK or other flags set.
Tabelle 3: TCP Flags
|
Flag |
Binary |
Decimal |
|---|---|---|
|
URG |
00100000 |
32 |
|
ACK |
00010000 |
16 |
|
PSH |
00001000 |
8 |
|
RST |
00000100 |
4 |
|
SYN |
00000010 |
2 |
|
FIN |
00000001 |
1 |
|
SYNACK |
00010010 |
18 |
Tabelle 4: Tcpdump Filter Syntax
|
Show |
Filter |
|
URGENT (URG) packets |
# tcpdump 'tcp[13] == 32' |
|
ACKNOWLEDGE (ACK) packets |
# tcpdump 'tcp[13] == 16' |
|
PUSH (PSH) packets |
# tcpdump 'tcp[13] == 8' |
|
RESET (RST) packets |
# tcpdump 'tcp[13] == 4' |
|
SYNCHRONIZE (SYN) packets |
# tcpdump 'tcp[13] ==2' |
|
FINISH (FIN) packets |
# tcpdump 'tcp[13] == 1' |
|
SYNCHRONIZE/ACKNOWLEDGE (SYNACK) packets |
# tcpdump 'tcp[13] == 18' |
Incident Response
When analyzing network traffic, a tool like tcpdump is critical. I'll share some examples of using tcpdump to view a couple of different dump files as a way to learn more about network problems or possible attack scenarios. The first is a binary dump file of a snort log. You have the following information: The IP address of the Linux system is 192.168.100.45; an attacker got in using a WU-FTPD vulnerability and deployed a backdoor. What can you find out about this attack and how it happened? To begin, take a look at the file:
# tcpdump -xX -r snort001.log
The log appears long at this point, so you might want to run the file in Snort,
# snort -r snort001.log -A full -c /etc/snort/snort.conf
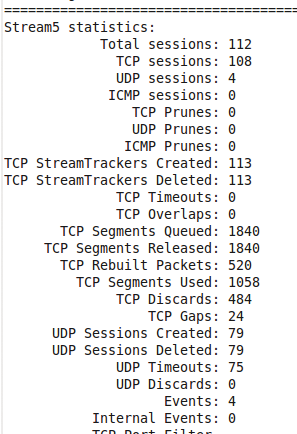
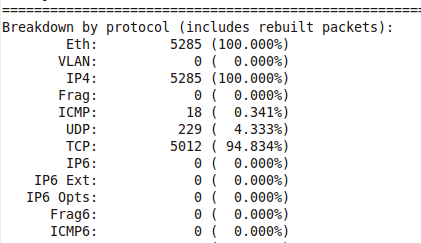
which gives you information like total packets processed, protocol breakdown, alerts, and so on (Figures 6 and 7).


Next, extract the full Snort log file for analysis, using
# tcpdump -nxX -s 1515 -r snort001.log > tcpdump-full.dat
which gives you a readable file to parse. After looking through it, you find ip-proto-11, which is Network Voice Protocol (NVP) traffic. Now you can search through the file looking for ip-proto-11.
# tcpdump -r snort001.log -w NVP-traffic.log proto 11
This command reads the snort001.log file, looks for log proto 11, and writes the contents to the NVP-traffic.log file. Next, you need to be able to view the binary file.
# tcpdump -nxX -s 1515 -r NVP-traffic.log > nvp-traffic_log.dat
This file contains both hex and ASCII, which is nice, but you just want the IP address. Try the following:
# tcpdump -r NVP-traffic.log > nvp-traffic_log01.dat
This outputs a list that tells you which IP addresses were communicating by Network Voice Protocol (NVP) (Figure 8).

With which IRC servers did the server at 172.16.134.191 communicate? To look for TCP connections, try using tcpdump with a filtering expression to capture SYN/ACK packets coming in from outside servers:
# tcpdump -n -nn -r snort_log 'tcp and dst host 172.16.134.191 and tcp[13]==18'
This command produces a long list of connections going from 172.16.134.191 to outside connections (Figure 9).

Because IRC communicates on ports 6666-6669, you can add that information to the command to narrow down the search:
# tcpdump -n -nn -r snort_log 'tcp and dst host 172.134.16.234 and tcp[13]==18' and portrange 6666-6669
Now the list has been narrowed down to three IPs that were communicating with the server of interest using IRC (Figure 10).

