Monitoring with Zabbix
Single Source
Back in 2001, Alexei Vladishev started working on a monitoring tool called Zabbix. Today, he is the owner and product manager of Zabbix SIA in Riga, Latvia, and Zabbix is a comprehensive tool for monitoring networks, servers, devices, and other IT resources that offers numerous visualization options. Like other tools of this type, Zabbix dispatches email messages, text messages, or instant messages in case of emergency.
In contrast to its main competitor, Nagios, Zabbix doesn't just display monitoring information in a web interface or a special browser plugin, it also supports full configuration of the hosts to be monitored in the browser. Zabbix uses MySQL, PostgreSQL, SQLite, or Oracle RDBMS to store data. The web interface is programmed throughout in PHP and offers both "simple checks" for monitoring standard services like SMTP or HTTP, and a number of agents for various operating systems that help administrators collect a variety of data for graphical representation on the Zabbix web front end.
Zabbix does not excel at checking outward-facing services such as FTP, SSH, or HTTP with built-in tools; it is essential to install one of the agents for professional use. Additionally, Zabbix supports SNMP as a means of collecting information. One of the tool's biggest benefits, compared with its competitors, besides the ability to configure host monitoring directly in the web interface, is the ability to combine actions, items, and triggers conveniently. Another notable feature is its management of graphs, screens, and maps – in particular, the very elegant way it displays individual hosts in various map types (geographical, infrastructure, and so on), which is part of the default installation scope.
Shapes and Sizes
Zabbix is released under the GNU GPL, and the latest version 1.8.9 can be downloaded from the project website [1]. Besides the source packages, administrators can choose between preconfigured applications in the form of ISOs, USB sticks, or a Live CD, as well as a virtual appliance in VMDK or OVF format based on openSUSE. Besides the server appliances, Windows, various Unix derivatives, and all the major Linux distributions have prebuilt agents.
Zabbix is also available from the repositories of many distributions – for example, Ubuntu 11.04 includes version 1.8.5. Besides Linux, Zabbix also supports Solaris, AIX, HP-UX, FreeBSD, and OpenBSD on the server side. An agent only is available for Windows systems, but at least this means you can monitor Windows hosts with Zabbix. The agent supports both 32- and 64-bit systems.
The Zabbix infrastructure comprises three components: the server, the front end, and the agent. The acquired data can be viewed by any Zabbix user with appropriate authorization via the browser front end. The server and the web front end don't need to run on the same machine, and the database can easily be installed on a separate host.
Setting up a Test Environment
The installation requirements of 128MB of free RAM and 256MB of free disk space, as cited by the developers, define an initial setup. In fact, the disk space you will need depends on the number of hosts you will be monitoring and various other factors. Despite this, network monitoring with Zabbix only rarely fails as a result of hardware requirements.
The fairly frugal requirements should not fool administrators into additionally assigning monitoring tasks to just any old file, database, or mail server in the enterprise, however. A monitoring system needs to be independent and highly available to fulfill its intended purpose. If you don't install the appliance, you will need a Linux server with Apache, PHP 5.0, the PHP GD module, your choice of database, and the matching PHP module, along with administrative privileges. If you intend to implement network monitoring with Zabbix on the basis of SNMP and are using Ubuntu, you will also need to install the snmp, libsnmp, and php5-snmp packages. This also applies to the system you are monitoring, assuming it is a Linux host.
If you prefer to build the latest version of Zabbix from source, you need the obligatory Build Essentials and the developer packages for MySQL and NET-SNMP. To support the web front end, you also need a working Apache web server with PHP support (libapache2-mod-php5). A manual installation also means you need to launch the database and create Zabbix with the required tables; after unpacking the source archive, you will find a create folder with matching schemas.
The Zabbix server daemon is configured in /etc/zabbix_server.conf, and most of the parameters described in the documentation come with meaningful defaults. The most important parameters here are the database name (DBName=zabbix), the database user (DBUser=root), the database password (DBPassword=), and the standard port on which the Zabbix daemon will listen by default (ListenPort=10051).
Similar to the Zabbix server configuration, you need to configure the agents in the zabbix_agent.conf file. The most important parameters here are Server=127.0.0.1 for the Zabbix server IP address, which defaults to localhost if the server and agent are running on the same machine (it can't hurt to monitor the Zabbix server, too) and ListenPort=10050 for the port the agent will listen on for server requests. Incidentally, you don't need to start the agent as a daemon; you can modify the configuration file /etc/zabbix/"zabbix_agentd.conf to change this.
These steps are not necessary for the appliances or for the prebuilt version: You can thus go straight to the configuration in the web front end, which you will find at http://Zabbix-Server/zabbix after completing the install. In the default configuration, you can log in with a username of admin and a password of zabbix. The other preconfigured passwords for the appliance are listed in Table 1 and will also work with the version from the distribution's package repository.
Tabelle 1: Zabbix Appliance Passwords
|
System |
Password |
Password |
|---|---|---|
|
System |
root:zabbix |
zabbix:zabbix |
|
Database |
root:zabbix |
zabbix:zabbix |
|
Zabbix front end |
admin:zabbix |
Zabbix Windows Agent
Installing the Windows agent is also very easy and, again, relies on a configuration file, C:\zabbix_agentd.conf, with syntax identical to the files in Linux/Unix. In other words, you can simply copy the sample file and make the necessary changes. To do so, you need to install the Zabbix agent as a service by typing zabbix_agentd.exe --install at the Windows command prompt or in the PowerShell.
You can set the --config option to specify the path to the configuration file. The configuration file for Linux can be used for Windows as described, but note that it contains typical Unix-style pathnames, such as /etc/zabbix/zabbix_agentd.conf, which you will need to change – for example, to C:\zabbix_agentd.conf. You will also need to allow the required ports (10050, 10051) at the firewall to make sure the server and agent can communicate.
Configuring Hosts
To add a host to the Zabbix monitoring scope, you can click on Configuration | Hosts in the web interface. The Zabbix server itself is included in the host list if you use the appliance as your test environment. There is no reason not to monitor the Zabbix server. To configure another host, first select all in the Group drop-down menu at the top right and then click the Create Host button. Zabbix shows you a host configuration dialog, where "host" in Zabbix-speak refers to any kind of network device that has an IP address or a DNS name.
What you need to enter in the Configuration of Hosts dialog, at the top in the input box next to Name, is not necessarily the hostname, but a freely selectable name for the monitoring process (Figure 1). Of course, you can enter the same name in this field and in the DNS name field at the bottom, assuming you use an intuitive name schema for your DNS. Below this, you can select a matching host group, or create a New host group. The default preconfigured groups are simply examples. You can then set up more technical parameters, such as the DNS name, IP address, or agent port number.

Incidentally, it is not absolutely necessary to install the Zabbix agent on a device for an initial test. And, it is quite sufficient to fill out the DNS name and IP address fields. The port field defaults to port number 10050 in the Zabbix standard configuration, and you don't need to change this. If you want Zabbix to work with different ports, you need to enter the matching values in /etc/zabbix/zabbix_server.conf on the server, or /etc/zabbix/zabbix_agent.conf on the host you will be monitoring before you modify this field. Initially, you can ignore the other options and press Save to create the host.
Monitoring
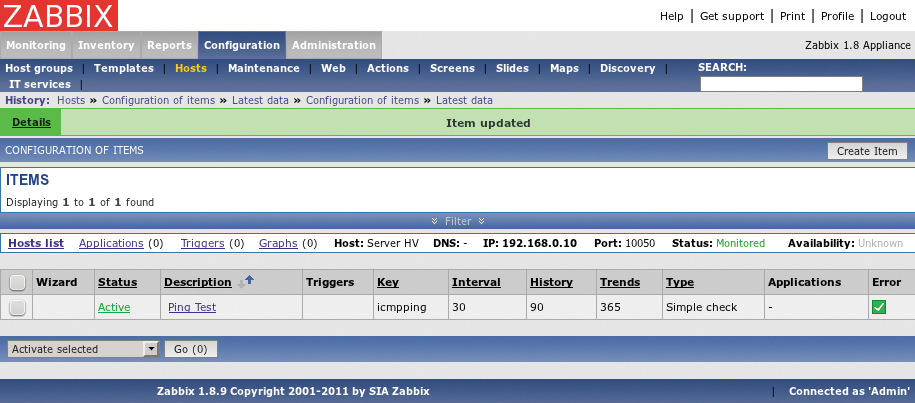
Once you have created the first host, Zabbix can start collecting its data. To begin monitoring, again click Configuration | Hosts and then the link in the Items column of the host list, which doesn't currently contain an entry (as you can see by the Items (0) link). The list in the Items dialog that appears will be empty. When you click on Create Item at the top right, Zabbix shows you the Item Hostname dialog with a Type selection box offering a variety of monitoring types: In addition to the default Zabbix Agent entry are various SNMP agents, an IPMI agent, an SSH agent, a database monitor, and external checks.
For this example, it's perfectly okay to select the Simple check entry; this allows the Zabbix server to check autonomously (i.e., without an agent being installed) whether the host responds to ICMP pings, for example. You need to enter the internal Zabbix key to match the scenario (ICMP Requests) in the Key. You could also click Select to display a selection list for an at-a-glance overview of all the keys for simple checks; this gives you an easy option for finding, say, the icmpping entry, which in turn gives you the following key for the entry:
icmpping[<ip>,<count>,<interval>,<size>,<timeout>]
If you do not need these options for your first test, you can remove the option list, including the square brackets, then proceed to set the entry to Active in the drop-down menu for Status.
The New application field is also of interest. When Zabbix says "application," it always means a group of items, which it views as a unit. In the sample scenario, you would choose the Availability group, leave the default values in the other fields, and complete the item definition by pressing Save (Figure 2).

You can check to see whether Zabbix really does collect the measured values specified in the item definition for the job by clicking on Monitoring | Latest Data in the main menu and expanding the description tree for Availability (1 items) by clicking the plus sign. Depending on the Interval you set (i.e., refreshing the page after 30 to 60 seconds), you should see the desired results.
Well Triggered
Once you have established that Zabbix is acquiring the values correctly for the item you just set up, you can turn to configuring the triggers. Again, this is done by visiting the Configuration | Hosts menu. Click the link in the Triggers column of the host list; the trigger list will be empty at first.
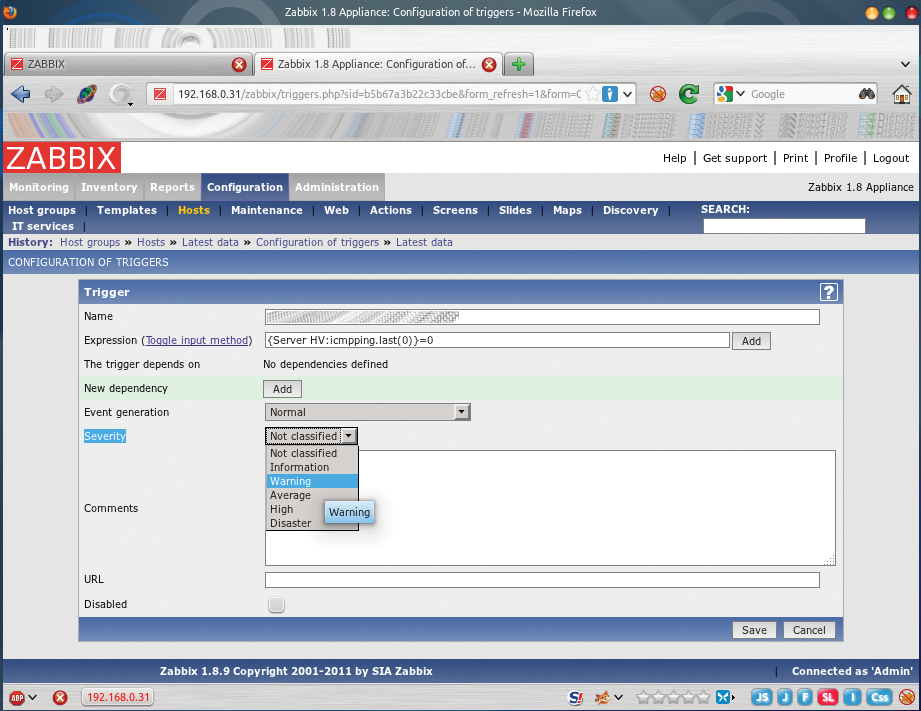
Next, press Create Trigger to do just that. The Configuration of Triggers dialog (Figure 3) expects an intuitive name. When you choose it, remember that the name will also be the subject line for the email sent when the trigger is tripped, as in, "Ping failed – host unreachable." There is no need to enter the hostname as the trigger name here.

Clicking Add creates the matching Expression. The expression defines the conditions under which the trigger assumes a status of true or false and is basically a comparison of the item's current value with the predefined threshold. Start by clicking Select to select an entry from the items list in the pop-up window. If the list is extensive, be sure to select the correct entry.
You can restrict the item list to the host in question by first explicitly selecting the required host group or host at the top right. This is actually fairly confusing at first, because you will be creating the trigger definition explicitly for this host, as you can see from the URL line of the Expression dialog. Zabbix lets you use items from other hosts for the trigger, although it will probably be the same host you need in most cases.
In this example, the Item field contains a Simple Ping Test entry. The entry for Function defaults to Last value = N; you can leave this as is – it means that the trigger will assume a status of "true" when the last value determined for the Simple Ping Test item is N (zero). You can stipulate that N is equal to zero (0) at the bottom in the N field. Clicking Insert defines the expression and takes you back to the Trigger dialog. Now, you just need to classify the trigger Severity, as Information or Warning, for example.
To complete the trigger, just click on Save. The trigger list should include the trigger you just defined. A green check mark in the Error column appears to indicate that the definition was successful. You can view the trigger status at any time below Monitoring | Triggers in the main menu. Note that you need to set the filters correctly using the Host or Group list boxes to tell Zabbix to show you the filters you just defined as well.
If the host you are monitoring is online, the status of the trigger you just created should be OK. If you isolate the test host from the network, its status will now change to PROBLEM (Figure 4). The figure also features two triggers with a problem status for the Zabbix server; the reason for this is that not all of the monitored services are configured on the appliance at this stage.

Notified
To be able to send an email when a trigger is tripped, you need to define a mail server and an action. To set up the mail server, go to the Administration | Media types menu. The Description column already contains entries for email, Jabber, and text messages. To set up email delivery for a trigger event, click the Email link and then type over the default values for SMTP server, Hello string, and SMTP email with the desired values.
Caution: SMTP email is the address of the mail account from which Zabbix will send the email. The email address that Zabbix sends the mail to is set in the Administration | Users menu. First you need to change the default entry, User Groups, to User. The appliance already has two default users, Admin and guest (Figure 5). You can now click the Admin link in the Alias column to process the administrator's user data. To do so, click Add for the Media item at the bottom of the dialog and then enter the desired email address in the Send to box. The checkboxes below this let you set the priority status with which Zabbix sends an email. Clicking Add adds the configuration to the user configuration dialog, where you can press Save to complete the process.

To set up an action, click Configuration | Actions in the main menu, select the Triggers entry for Event source, then click on Create Action. The dialog in Figure 6 mainly expects a freely selectable name for the action you are defining, as in Send message. The Event source should be Triggers to reflect your previous choices.

In the field below this, you can set the standard subject line for the message to be sent. The field defaults to {TRIGGER.STATUS}: {TRIGGER.NAME}, and you can extend this to include {HOSTNAME}: {TRIGGER.STATUS} so the recipient will see immediately which host the problem refers to when the message arrives. The default content for the message to send is also configurable using wildcards. Below the Action dialog, in the Action conditions dialog, you need to check (A) Trigger value = "PROBLEM" for Conditions.
To do so, click on New for the Action operations dialog at the top right to add a new action; this expands the Edit operation area, where you can then finally set the operation type to Send message, set User group for Send message to, and select Zabbix Administrators in the field to the right by pressing the Select button to open the groups list. You can alternatively select Single user and then use the Select button to explicitly choose the Admin user as the recipient.
After completing these steps, press Add to close the Edit operation dialog, and then press Save to close the entire Action dialog. To test the results, again isolate the test host from the network, and you should receive the configured email just a short time later.
Touching the Surface
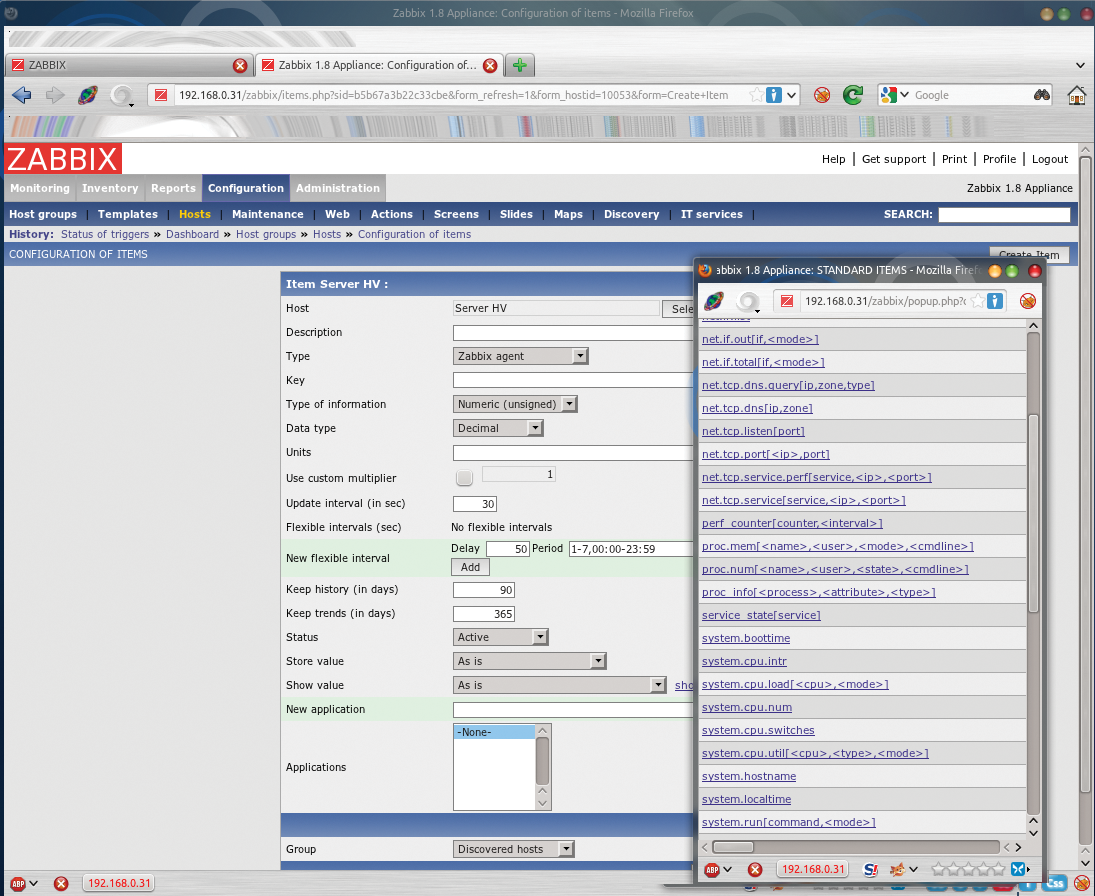
The minimal example I looked at here only uses Simple check as the item Type, and the Zabbix server doesn't need an agent for this. However, it does illustrate how intuitive and convenient the configurable interaction between items, triggers, and actions is. It also shows the steps required to set up the alerting function. Figure 7 shows that an item Type of Zabbix agent uses a far greater number of keys, which makes it much better suited to production use.

A Zabbix agent is the most convenient approach to network monitoring because support for the SNMP network monitoring protocol is implemented by more or less any modern operating system, router or switch firmware, and so on. In this context, the protocol controls communications between the monitored devices and the monitoring station.
The article this far has only touched the surface of Zabbix's feature scope. A direct comparison with Nagios, Icinga, and Shinken is given in a separate article in this issue. Zabbix's concept and architecture are much more coherent than the slightly outdated Nagios, which only manages to keep pace with Zabbix's feature set thanks to a plethora of add-ins. In fact, this article doesn't even touch on Zabbix's monitoring and visualization functions or on the use of templates.
That said, administrators who decide to use the appliance can familiarize themselves with the built-in and preconfigured monitoring functions offered by the Zabbix server in the form of templates, among other things. The PHP program is so intuitively designed and usable that administrators will soon find their way. The main Monitoring menu provides a dashboard as a convenient point for keeping an eye on a whole flock of monitored devices.
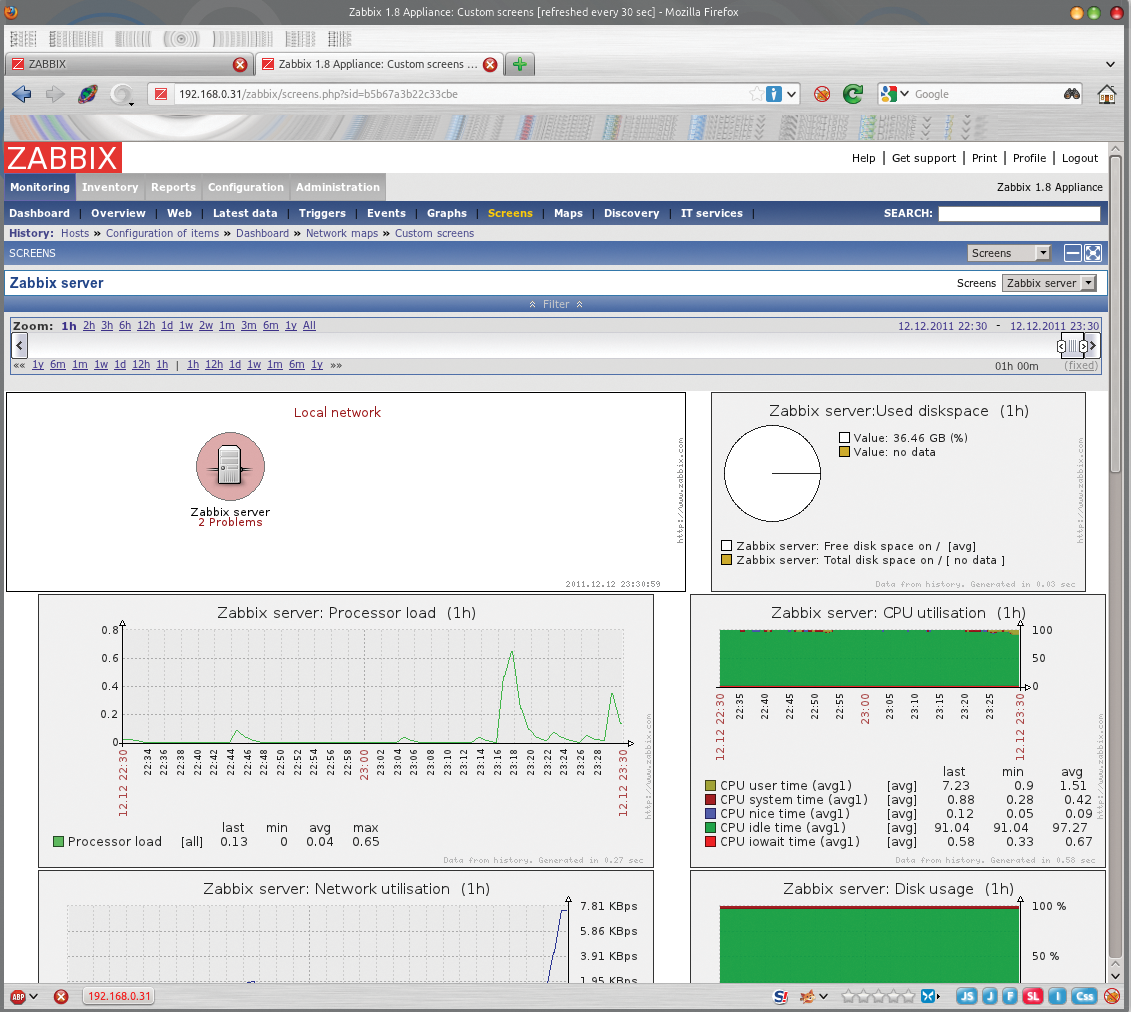
In regard to the excellently implemented visualization functions, you will definitely want to take a closer look at the Graphs, Screens, and Maps menus (Figure 8). If you are familiar with Nagios, you will be excited by Zabbix.

Conclusions
Without a doubt, Nagios has shown what open source tools are capable of in the field of monitoring for years and has achieved notable popularity. But Zabbix does a better job almost everywhere you look and impresses with its coherent concept.
If this is your first excursion into network monitoring, Zabbix will give you the results more quickly with its excellent web interface. This interface doesn't just act as a centralized monitoring control room, it also helps the administrator configure hosts, items, triggers, and alerts.
