Monitoring KVM instances with Opsview
Pulse Counter
Since the Linux kernel 2.6.20 release in February 2007, the Kernel-Based Virtual Machine, KVM [1], has made much progress in its mission to oust other virtualization solutions from the market. KVM also frequently provides the underpinnings for a virtualization cluster that runs multiple guests in a high-availability environment, thanks to Open Source tools such as Heartbeat [2] and Pacemaker [3].
Very Little Monitoring
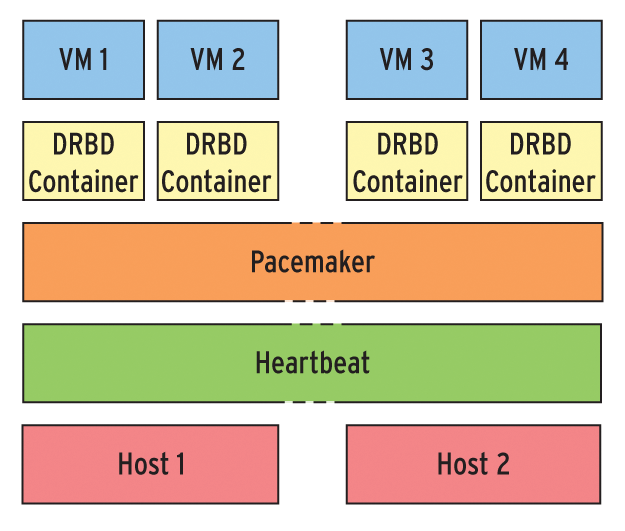
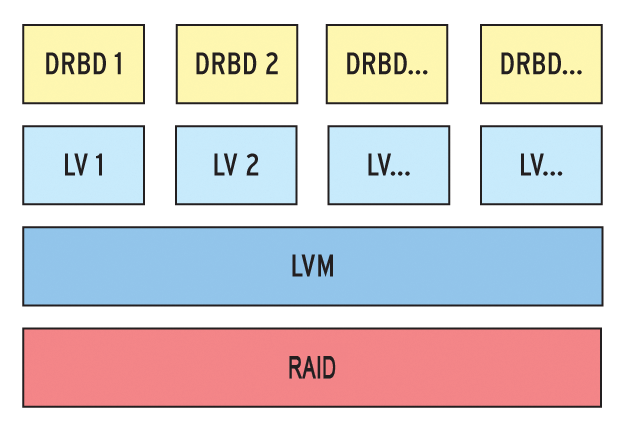
Many system administrators still don't monitor the hosts and virtual guests in their clusters. Heartbeat and Pacemaker have built-in alert functions, and many admins are happy with email notification of cluster status. However, a standardized, centralized monitoring system that also covers the virtual guest systems in a private cloud can give admins an impressive operations center for monitoring all of the systems at a glance. Before you think about monitoring, you need to consider a couple of basic things about your cluster setup: A simple combination of Heartbeat and Pacemaker, with virtualization based on KVM, logical volumes, and DRBD [4] may not match the feature scope of VMware, but it won't cost you nearly as much either (Figure 1). With minimal effort, this simple Heartbeat solution provides a system in which a virtual instance is always available.
Permanent data synchronization courtesy of DRBD ensures that the data stored on virtual hard disks is immediately available in case of a failure although unsaved user session data will be lost – just as if a local machine were to crash. If one of the virtualization hosts fails, the virtual machines automatically reboot. All of the instances run on a single node in this case. Your users can continue working, assuming the remaining node has enough resources to go round.
DRBD and Logical Volumes
Figure 1 shows an example of a Linux cluster with two nodes based on the Linux CoreBiz VSB (Virtual Server Base) [5] system by Munich-based LIS AG. The stack for the virtual hard disk used by a virtual machine comprises physical storage (typically a RAID system), an LVM partition, and a DRBD container used for replication between the two nodes. The container is assigned either directly to the virtual machine or, alternatively, to the cluster where it is then used as a partition for an image file (Qcow2, Vmdk, …).
Cluster management is handled by a combination of Heartbeat 3 and Pacemaker. Heartbeat 3 allows the nodes to exchange messages, and checks whether it can still hear the "heartbeat" of a node, that is, if the node is still available.
Pacemaker as the Cluster Resource Manager (CRM) knows which services in the cluster depend on one another, and it is also aware of their health state at any given time.
Pacemaker is particularly interesting for monitoring. To discover the status of the cluster resources, it uses Open Cluster Framework (OCF) agents [6], which are a kind of advanced version of the Linux Standard Base (LSB) resource agents, which admins will find as init scripts below /etc/init.d on a Linux system. An agent of this kind typically provides the following functions:
-
start: Starts the resource -
stop: Stops the resource -
monitor: Outputs data on the resource status -
meta-data: Outputs information about the resource
Although administrators can create OCF agents in any programming or scripting language, most agents are simple shell scripts. Other parameters that many agents need in order to perform the above-mentioned actions are defined in the Pacemaker resource configuration. Administrators also need to define timeouts and monitoring intervals.
You need to assign a matching agent to each resource in the cluster and pass the required information into the agent. The KVM cluster needs an agent for DRBD and to manage the virtual machines. The ocf:heartbeat:VirtualDomain agent is a good choice for managing virtual machines, although CoreBiz uses a proprietary development.
Besides starting and stopping resources, Pacemaker also checks the resources automatically at regular intervals using the OCF agent's monitoring command. This process helps the cluster keep track of the various resource states at any given time.
By default, the CoreBiz OCF and the virtual domain agent only check whether a KVM instance is active – not whether an individual service is reachable. However, ocf:heartbeat:VirtualDomain supports more tests to check the availability of any service and to restart the service on other hosts as needed. Of course, this doesn't fix the cause of the problem.
Agents, Agents!
Once the standalone KVM host, or a whole cluster based on the components described previously, is up and running, you can start monitoring the individual resources. Administrators first need to think about the correct choice of tools and the resources they want to monitor. Because the hosts have no way of knowing which applications are running in the isolated virtual environments in the case of hardware or software failure, planning needs to focus on the services, processes, and applications running on the guest systems.
You additionally need to ensure that the KVM instance is actually up and running. In a cluster, an additional problem is that the monitoring application has no way of knowing the node on which the virtual machine is running. The application typically only checks the services in the form of IP addresses in combination with specific ports.
It makes sense to leave the task of monitoring KVM instances to Pacemaker because it knows all about the resources in the cluster. Your choice of monitoring tool should thus – in the cluster at least – focus on monitoring Pacemaker. This example will be using the Nagios check_crm plugin to handle this; crm stands for Cluster Resource Manager.
In standalone operations, it makes sense to perform standard checks to monitor the host. The candidates include availability on the local network, system load, and SSH access – after all, you will probably want to know if remote access to the host is possible. In other words, you need to keep an eye on the following resources for the KVM host:
- Connectivity (LAN)
- Unix load
- RAM/Swap load
- Storage utilization
- SSH availability (typically on port 22)
- Optional extensions: If you use libvirt, you can check if the libvirtd daemon is running (Figure 2).

In most cases these checks are sufficient to give you a reliable statement on the state of the host. If you extend the KVM system to create a cluster, as described earlier on, you should then at least add the CRM and DRBD services to your monitoring scope.
Guests, What Guests?
Because the cluster itself has no knowledge of what is happening on the virtual machines, the monitoring system also needs to monitor the guests. The requirements for each Linux guest will be more or less identical to the requirements for the host system. In addition to the basic checks for each guest, you will also have (typically multiple) individual extensions because, depending on the use scenario, you will need to monitor the services provided by the individual guests. For a web server, this would include whether or not you can reach, for example, Apache via HTTP, FTP, and the database if one exists.
Windows guests can be monitored by checking the availability of the following system resources:
- Connectivity (LAN)
- CPU load
- RAM
- Swap file
- Free capacity on the drives
- Availability of RDP access for remote management
- Monitoring of the Windows event logs
Application,SecurityandSystem
Additionally, you will definitely need to monitor the application for which you installed the Windows guest. If this is a CRM, you could search for certain services and processes that need to run permanently. If a service fails, at least you would discover the fact in good time.
When it comes to the choice of monitoring tools, selecting a tried and true solution is always a good idea, and this would seem to suggest Nagios [7]. With its many freely available plugins and extensions, Nagios is often the tool of choice for keeping an eye on your standalone servers and clusters. This article describes Opsview [8], which is based on Nagios (Figure 3).
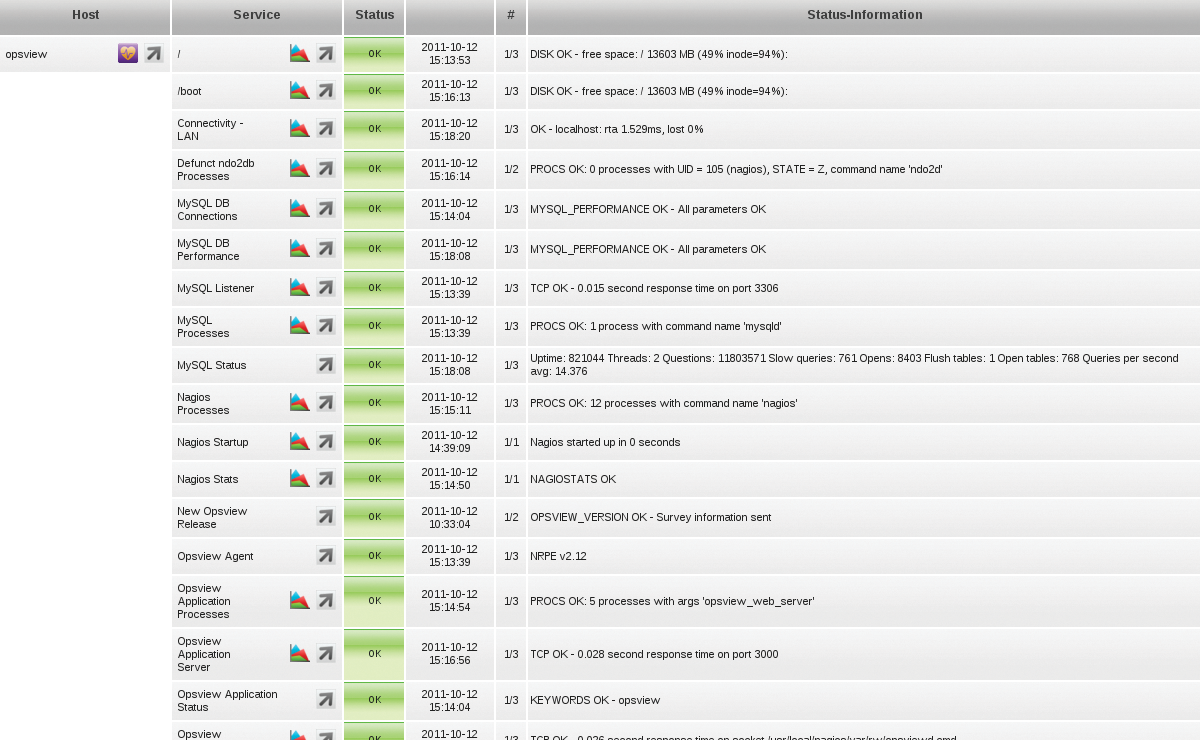
Opsview stores all of your settings in MySQL databases and uses the databases to generate configuration files for Nagios. You can also perform additional service checks to, say, monitor the Unix load. The generic service check parameters then apply to all hosts that are assigned the same check for monitoring purposes. Because the monitored systems typically perform different tasks, you can also specify service checks in more detail as properties that you define individually for each host.
One good thing about Opsview is its notification profiles, which even make sense for smaller KVM installations. Notification profiles provide administrators with the option of notifying only the owner of the virtual instance about a failure, thereby preventing this information from being sent to uninvolved third parties.
Arguments in Favor of SLA Agreements
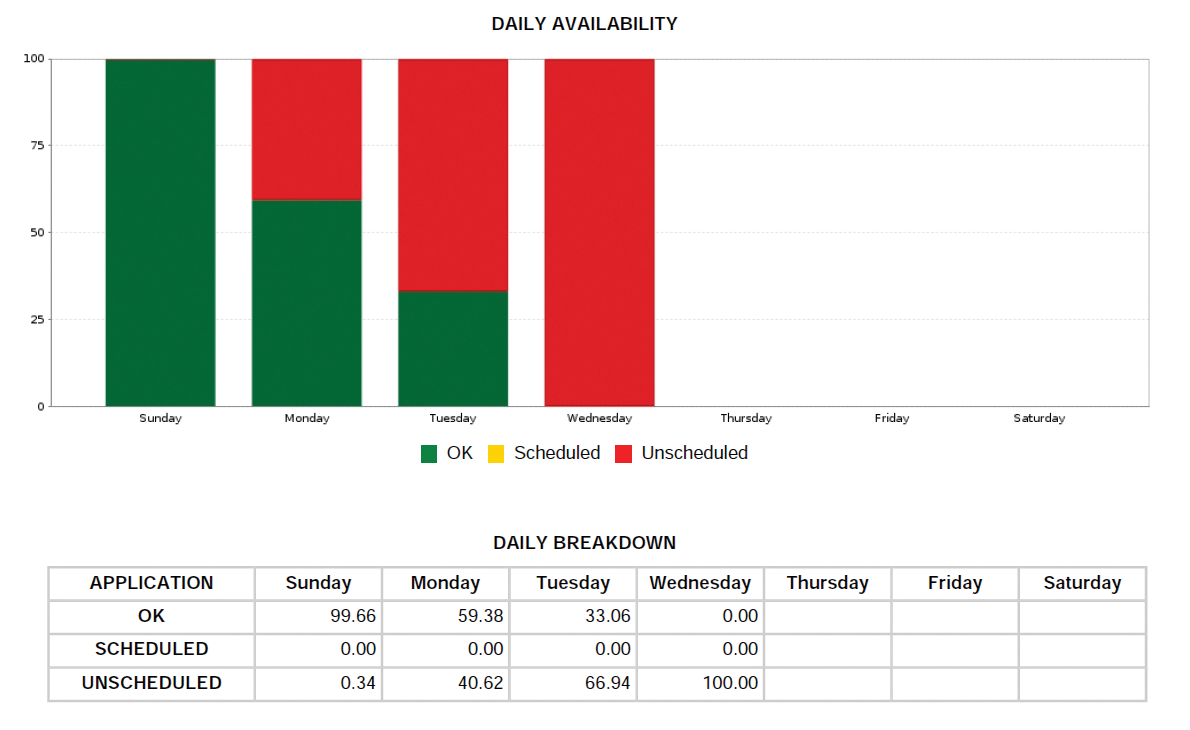
Fans of statistics and larger-scale evaluations will also appreciate the option of assigning keywords to the checks, and thus grouping resources. The Create Report feature in Opsview evaluates these keywords and creates PDFs with useful statistics on the availability of the individual resources. Companies that use SLAs can work with these reports to demonstrate compliance with agreements to their customers (Figure 4).
A word of caution: Make sure you only create one report at any given time. Even Opsview installations with a small number of service checks can otherwise cause a high level of system load.
Additionally, it is worthwhile checking out the vendor's website, where you will find useful tips on optimizing MySQL. Applying these tweaks can also offer performance benefits in daily use of the monitoring software.
An App for the Admin's Android
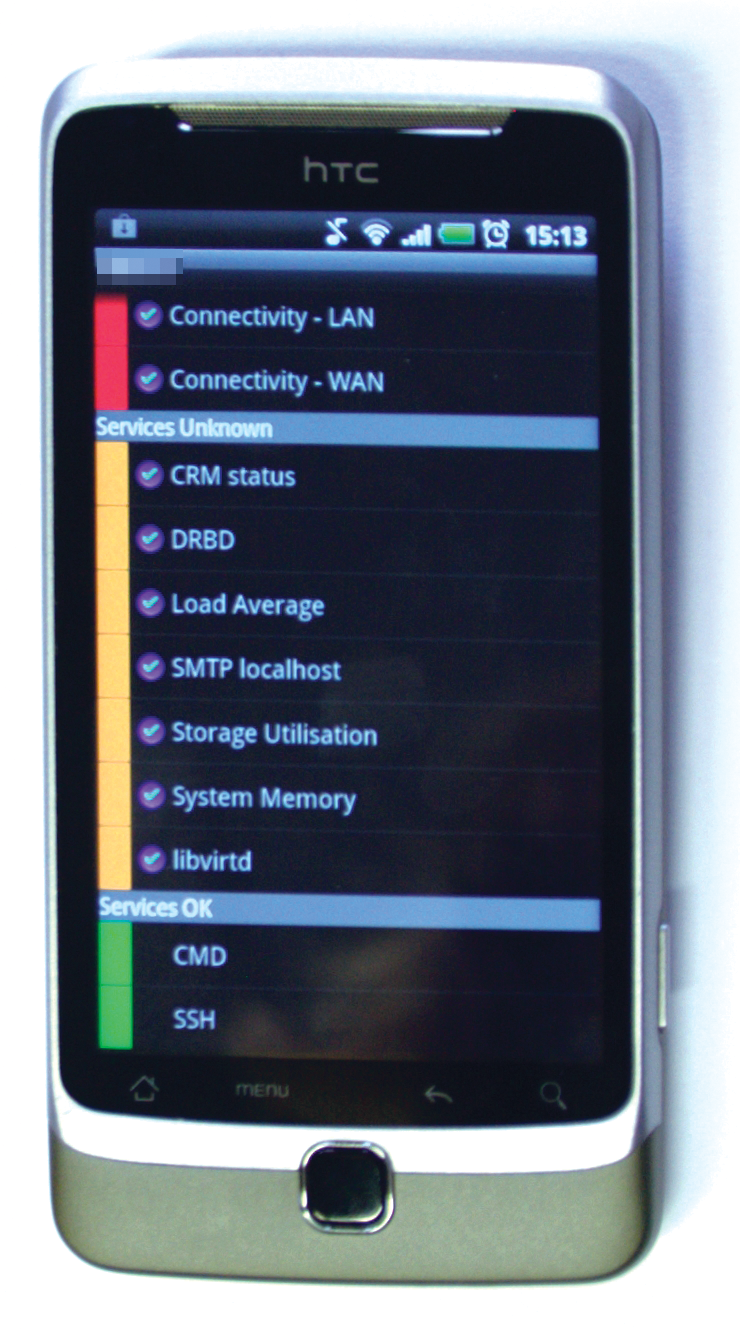
Avid users of Open Source will also appreciate an Android app and a browser plugin for Google Chrome that lets them keep an eye on all of their servers wherever they are. Really conscientious system administrators who like to monitor their KVM system while on the road can check out the free Opsview Mobile Android app [9] (Figure 5). After entering the API URL for Opsview and your login credentials, the app shows you the status of your monitored systems, or at least it does if your monitoring server is accessible from the Internet.
If you need to monitor Windows systems, try out the Opsview Agent for Windows, which is available in 32-bit and 64-bit versions. The agent will even run on older Windows 2000 server installations, and it builds the foundations for integrating Microsoft guests into your monitoring setup. The tool, which is based on NSClient++ [10], is installed like any other normal piece of software.
SNMP Traps and LDAP
In enterprise environments, Opsview gives administrators the option of evaluating SNMP traps, opening an LDAP connection, or distributing the monitoring tool over multiple servers. An enterprise variant is also available. Depending on the feature set, it costs between US$ 10,000 and 50,000, although the Community Edition is fine for most setups.
Opsview provides a plugin each for DRBD and the Pacemaker Cluster Resource Manager, thus giving administrators a reliable option for querying the current health state. The plugins typically reside in /usr/lib/nagios/plugins on the KVM host. The Perl script responsible for monitoring DRBD goes by the name of check_drbd, and it can also be executed in the shell. It evaluates the output from /proc/drbd and returns the states OK, WARNING, CRITICAL, and UNKNOWN as the case may be.
In Opsview itself, you can create a simple check_by_SSH check to evaluate this output:
check_by_ssh -H host_address -l username -C "/usr/lib/nagios/plugins/check_drdb -d All"
The -d ALL parameter tells the agent to run the check against all DRBD devices (Figure 6). It determines the CRM resource state in a similar way. Every KVM host includes the Perl check_crm script, which calls /usr/sbin/crm_mon and checks the output for errors. Just like checking DRBD, the service check itself is also created by check_by_SSH:
check_by_ssh -H host_address -l username -C "/usr/lib/nagios/plugins/check_crm"
Nagios then regularly opens an SSH connection to the monitored server and runs the specified command.
Automatic Actions
Besides standard monitoring of resources and alerting in case of emergency, monitoring can also serve as the basis for additional actions. You might consider triggering automated actions if some service checks return a WARNING status.
For example, if a cluster load looks to be close to an overload, the hypervisor could automatically migrate defined virtual guests to a second node. The fully occupied node would thus have the ability to recover, rather than running the risk of impacting the cluster due to a total failure.
Automated failover between active hosts is only possible if you can allow a couple of minutes of downtime on the virtual machines affected by the problem. If this is not an option, a live migration of the guests might help. However, this process is far more complex and relies on concepts such as multiple primaries and fencing in the cluster setup.
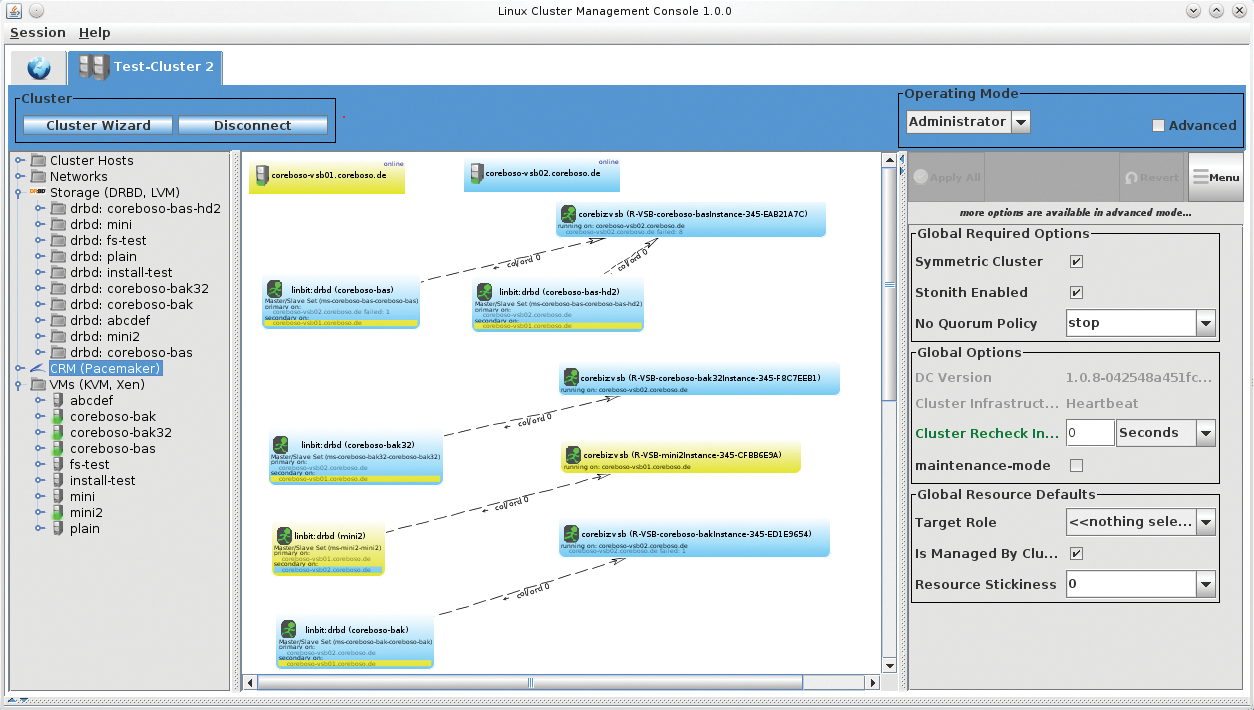
A number of GUI tools are available for managing a Pacemaker cluster, all of which simplify resource management. Probably the most complete implementation is the DRBD Management Console [11], which is developed by Linbit from Vienna, Austria. The name of this tool is somewhat misleading, because it goes well beyond DRBD management and actually covers all of the Linux cluster components, including Pacemaker, Corosync, Heartbeat, DRBD, KVM, Xen, and LVM.
The latest fork of DRBD MC is called the Linux Cluster Management Console (LCMC [12]; Figure 7). You can read all about the reasons for this in the announcement online [13]. It remains to be seen how LCMC will develop in the future, with the previous developer continuing to work on the project in his free time [14].
