
Performance testing monitoring solutions
Monitor Rally
The Nagios environment [1] contains a large number of components that cooperate to provide a platform for monitoring IT systems.
Starting with the Nagios core, which is responsible for running checks and triggering notifications, through visualization solutions like Nagvis and trend detection tools, the various parts of the Nagios environment all have to mesh.
Each one of these tools generates a different load, and each tool requires different approaches for removing bottlenecks and improving performance.
A full analysis of all the Nagios components and the way they cooperate would be extremely time consuming. In an effort to understand Nagios performance, I decided to focus on the most important part of the monitoring solution: the Nagios core. I considered Nagios from the viewpoint of a simplified system. This is a practical test – or to be more precise, a gray box test – that ignores the internal workings of the core.
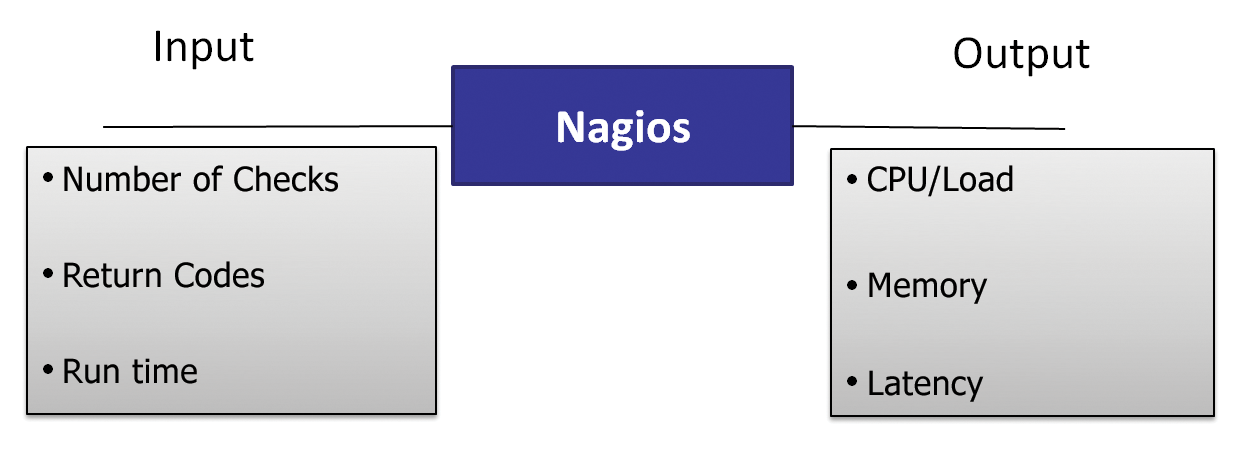
Figure 1 shows the system I will analyze in this article. The Nagios core in the middle is the central component. The objective of the following series of tests is to make more precise statements about the core's behavior in various deployment scenarios.
Input Parameters
The approach described in this article is a pragmatic compromise with respect to the complexity of the parameters. Of course, many other variables will affect performance; however, I hope you agree that the input parameters I used allow me to make some useful statements about the Nagios system:
- Number of Checks: The purpose of this parameter is to discover whether the number of service checks the system needs to perform has an effect on performance.
- Return Codes: A plugin that identifies a problem uses the return code to report it back to the Nagios core. Depending on the number of negative messages received for the service check, the core will take further action, such as computing the soft or hard state. Some notifications might also come at the end of this chain of logic. This parameter will provide the answer to the question of whether the evaluation logic has an effect on performance.
- Run Time: A plugin's run time is measured from the point at which it is called by the core up to the time it returns the return code. In the worst possible case, executing a plugin will cause a timeout because the component you want to monitor simply isn't reachable. This parameter investigates the influence that the execution time has on the system.
Output Parameters
I defined three metrics to measure system performance in these tests:
- Nagios Latency: Planning the execution time for the individual checks is a complex matter – it doesn't make sense to perform all the checks at the same time because this would cause uneven load on the system. For this reason, the Nagios core has its own intelligence to manage this behavior. Nagios Latency is a measure of how well the core can modify execution times. It indicates the difference between a planned execution time for a check and the actual time of execution. If the value is too high, the system has failed to keep up with the increasing number of checks.
- CPU Load: A classic means for determining the CPU load is to count the number of processes waiting for CPU time. Knowing the number of waiting processes, along with the number of processes currently running and the number of processes waiting for I/O time, will let you compute the load average for the Linux system. As a rough guideline, if this number is less than the number of CPU cores built into the system, everything is fine.
- Memory: Along with CPU load, memory load is an interesting metric for a Linux system. The focus here is on the maximum amount of memory an application can use, which you can approximately measure by subtracting the buffer and cached values from the used value.
The Simulation
I want to minimize the effect of the simulation on the system as much as possible. In this case, all the input parameters will be editable, and I will keep the CPU and memory consumption as low as possible.
In other words, I need a plugin that is flexible and easy on the CPU. I decided to develop a plugin in Perl for the test that is bound to virtual service checks in the Nagios configuration; the service checks themselves run on virtual hosts.
The Perl script is integrated into the system as follows:
define command{
   command_name check_ok
   command_line /usr/lib/nagios/plugins
   /sampler_do_nothing.pl $HOSTNAME$
   $SERVICEDESC$
}
Most important are the $HOSTNAME$ and $SERVICEDESC$ parameters, which tell the plugin the host/service associated with the simulation. Some variation in the simulation events is desirable. It would be unrealistic for all the checks to shift from OK to Warning or Critical at the same time.
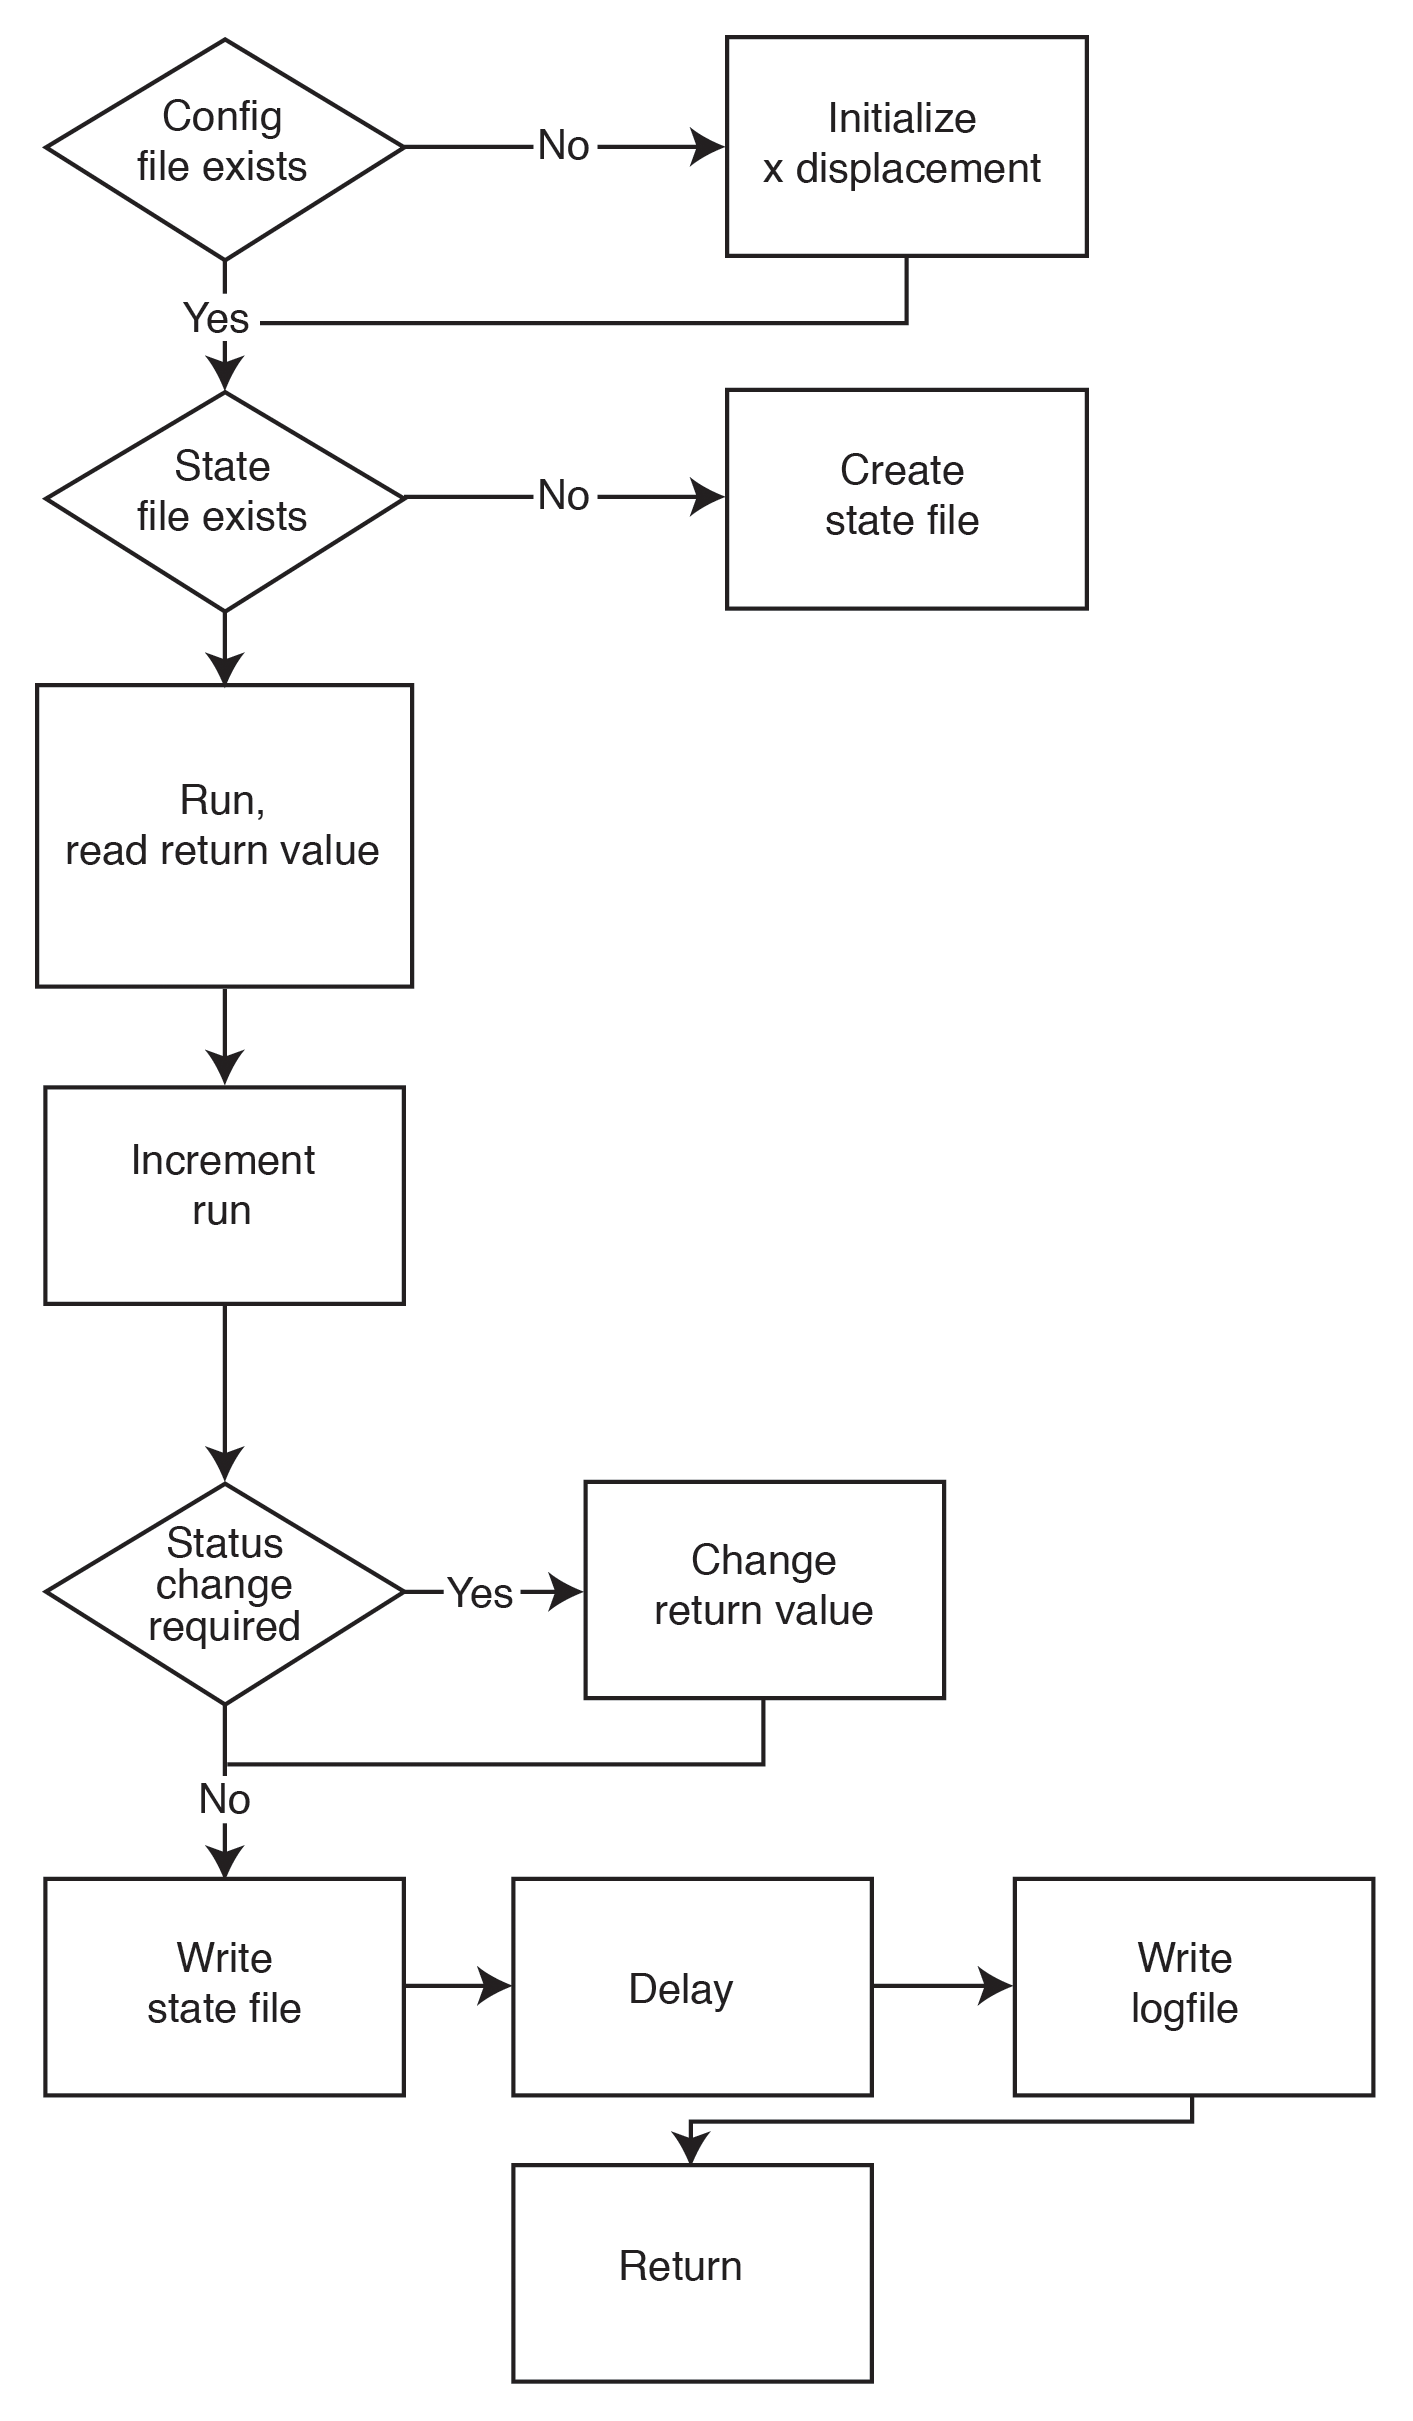
Figure 2 shows the details of the sequence. When the plugin is called for the first time in the given host/service combination, it computes an offset for the status change point. This determines the rhythm for running through the various status codes.
I used the Sar tool from the Sysstat package for measuring low-level values like the CPU load. The script stores the measured values every five seconds; the values are converted to CSV format later using sadf and passed to Gnuplot for visualization.
Testing Nagios Core
The first three tests relate to the standard Nagios core without any patches or other performance tweaks. The objective was to achieve a better understanding of the influence that the previously mentioned parameters have on the system's performance. Also, how does the number of checks affect performance? Is there a direct relationship between the number of checks and the CPU load or Nagios latency?
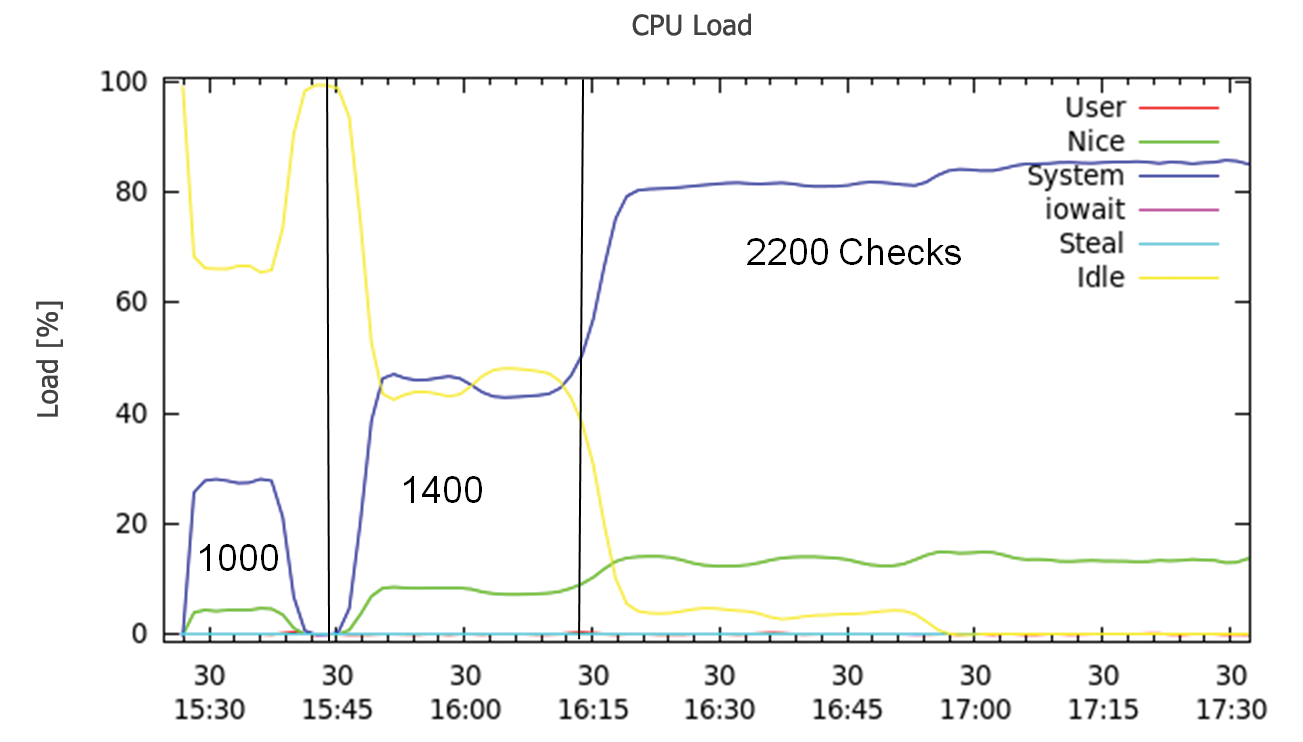
The tests were run on a virtual system (using ESX as the hypervisor) with fixed reservations for CPU and memory. To be more precise, I used a virtual CPU running at 1.5GHz and with 512MB of RAM in the virtual machine. On the basis of these hardware conditions, I gradually increased the number of checks, starting with 1,000 checks, then moving up to 1,400, and finally 2,200.
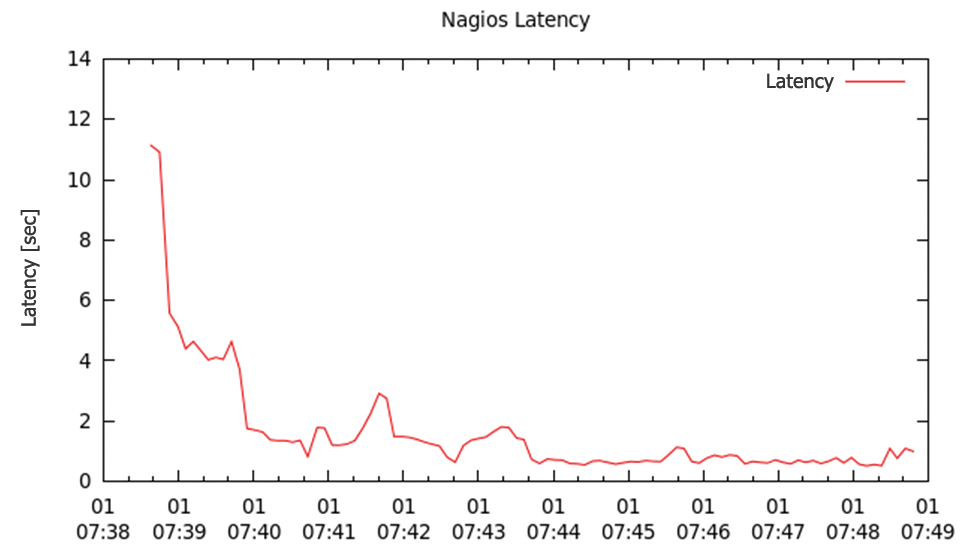
Figure 3 shows how Nagios latency changes over time, with the x axis showing time progression, and individual phases with the number of checks indicated above the axis. The y axis shows Nagios latency in seconds. One thing you might immediately notice is that there is no direct relationship between the latency and the number of checks. Increasing from 1,000 to 1,400 checks caused more or less no change to the latency figure, but the latency increased rapidly at 2,200 checks.

A quick look at the CPU load (Figure 4) explains this behavior. As long as enough CPU time is available (yellow line), the Nagios latency value stays low. As of 2,200 checks, the CPU load reaches a point where at which no resources are available, and this results in an abrupt increase in latency. If you turn this around, two virtual CPUs should cause the latency to drop at 2,200 checks, and Figure 5 confirms this.
Effect of Run Time and Return Code
Another factor that plays an important role in practical scenarios is run time of the individual checks. Many checks run remotely on other hosts, using SSH or NRPE (Nagios Remote Plugin Executor), for example. The CPU load on the Nagios system is typically low, and the question I thus need to answer is whether the check run time affects the Nagios latency figure. Again, I used the same configuration as for the first tests, the difference being that the scripts now have to wait between 0 and 10 seconds, thanks to a sleep() call, before terminating.
Compared with Figure 6, you can see that execution time has a substantial influence on latency. No changes were measured in terms of the CPU load. All of the checks in the previous test returned a status of OK, which is obviously not realistic.
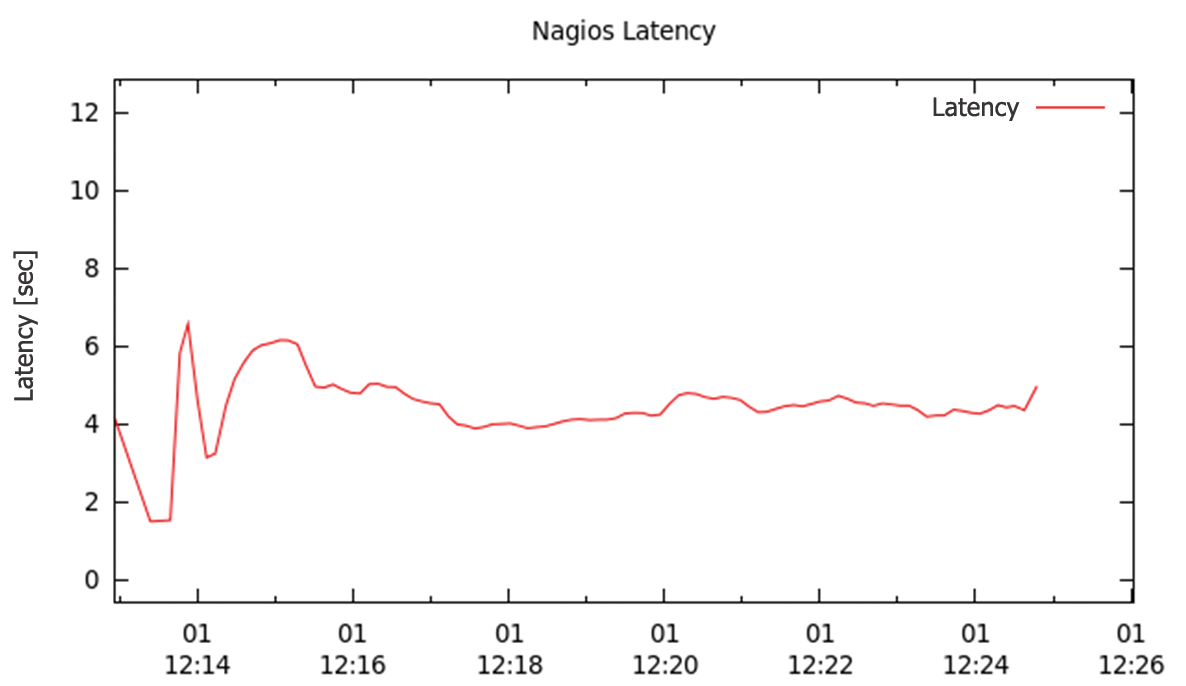
Next, I wanted to find out the effect that checks returning NOK results had on system performance. Because the Nagios core has some additional computations to perform in this case, I expected performance to be poorer. Again, the configuration from the previous test was used: two CPUs, 2,200 checks, run every 60 seconds, delays between 0 and 10 seconds, but this time 10 percent of the checks changed between OK, Warning, and Critical status.
Compared with Figure 6, Figure 7 shows an obvious change. Latency increases from five seconds to an average value of seven seconds.
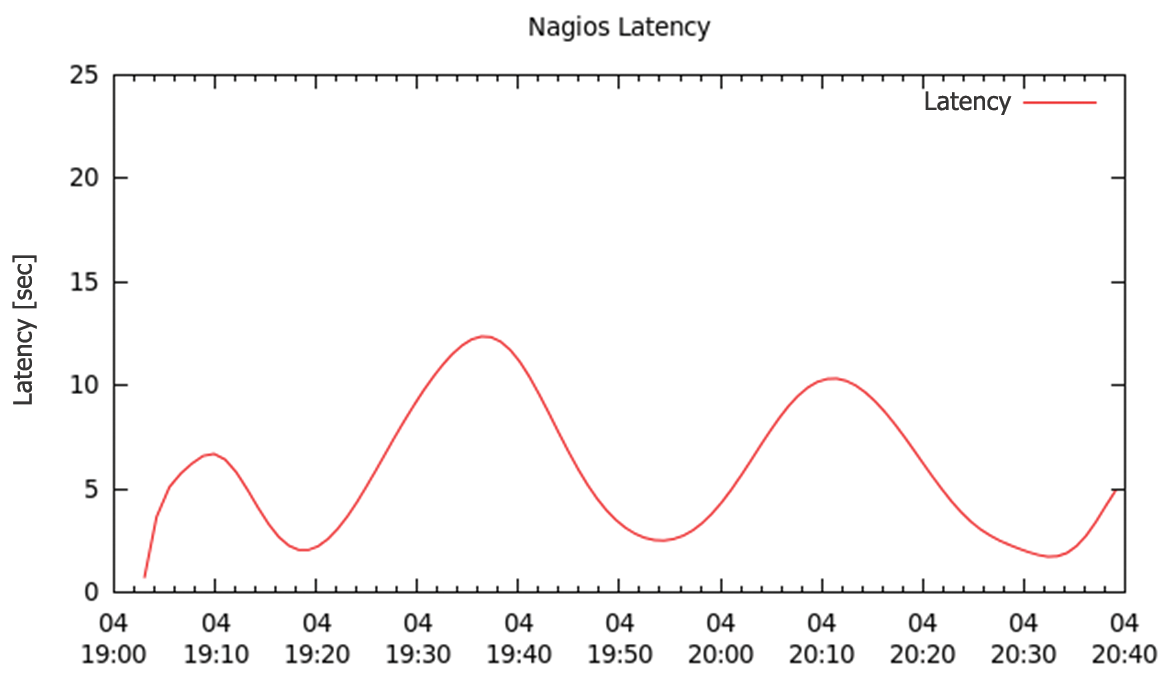
Interestingly, the oscillation in latency shown in Figure 7 isn't directly related to the CPU. The CPU load is around 80 percent (Figure 8), but still below the figure measured in the first test, so latency doesn't increase abruptly.
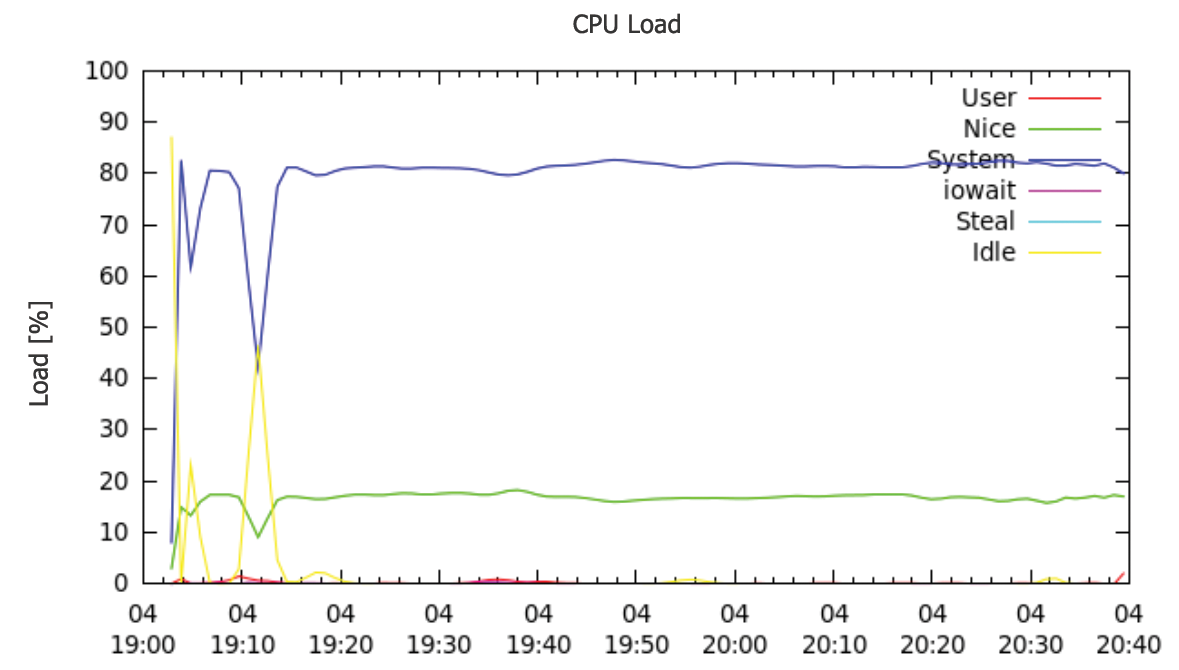
What does this test reveal? The surprising thing is the lack of a direct relationship between Nagios latency and CPU load. A CPU working at full load will cause an abrupt increase in latency, but a high latency value doesn't necessarily occur in the context of a high CPU load.
Many changes have occurred in the Nagios universe over the years. And, for a long time, the original Nagios core developed by Ethan Galstad was the only development path; however, technical disagreements and competing business interests have led to the release of a number of Nagios alternatives and extensions, including those discussed in the following sections.
Alternative Technologies
Icinga: Since 2009, Icinga [2] has mainly focused on front-end functionality. It thus offers a very flexible GUI and relies on its own database back end, avoiding the often criticized NDO database schema of Nagios.
mod_gearman: Sven Nierlein from Munich-based Consol set out to create a mechanism for distributed check execution with mod_gearman [3]. Communications between individual computer nodes use a framework specially developed for load distribution. (This approach solves some issues with the existing Nagios architecture.) The queues managed centrally by the Gearman server provide load distribution, combined with a redundancy feature for check execution.
Shinken: Jean Gabes, the main developer behind Shinken [4], analyzed Nagios from the distributed monitoring point of view. Unhappy with the existing approaches, he began to develop a new concept in Python. He decided to launch a separate project designed and written from scratch, yet with the goal of remaining compatible with Nagios.
Merlin: Merlin is a GPL-released component of a monitoring solution by Sweden's op5 AB. Like mod_gearman, Merlin distributes the load over multiple computer nodes using its own communication architecture. Unlike mod_gearman, an independent Nagios installation is required on any computer node managed by Merlin. However, this requirement means Merlin is capable of implementing fully redundant Nagios systems.
Comparative Testing
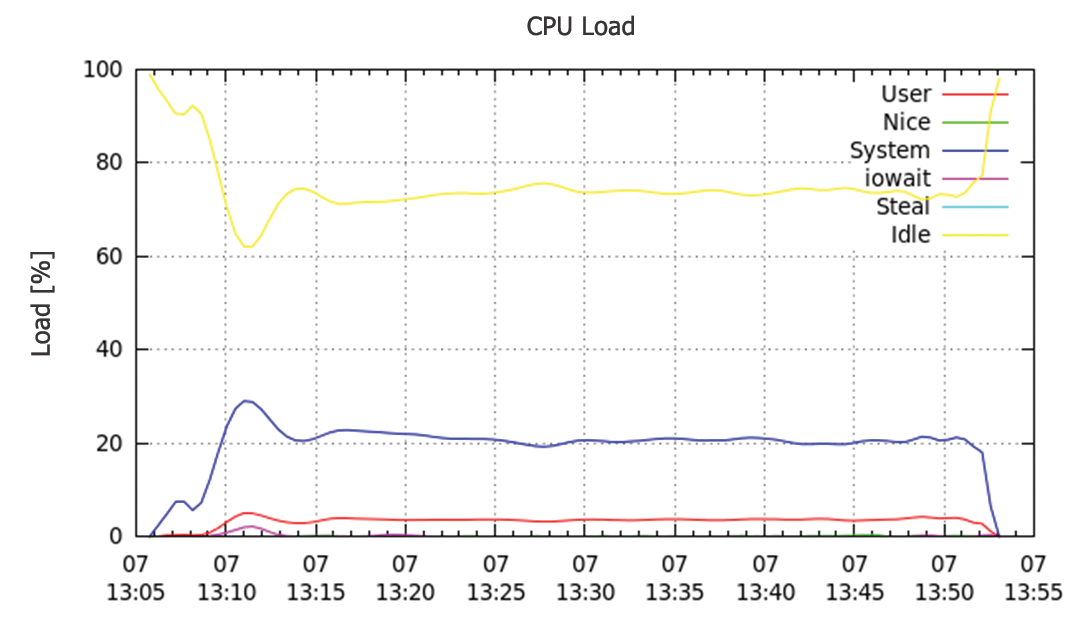
These technologies were also tested under laboratory conditions. The first comparative test uses the setup from the last Nagios core test but integrates the mod_gearman broker module. The results are clearer than expected. Whereas Nagios latency in the previous test (Figure 7) was around seven seconds, it now drops, as shown in Figure 9, to less than 0.5 seconds (Figure 10). Figure 11 shows that the CPU load also drops considerably in addition to latency. Mod_gearman causes a performance boost while using the available resources more frugally.


The same setup was used to test Shinken. The results are similar to those achieved by mod_gearman: Latency drops substantially, although the value is slightly higher than with mod_gearman (Figure 12). On the CPU side, Shinken needs slightly more resources (Figure 13); however, the values are still well below those of the legacy Nagios core.
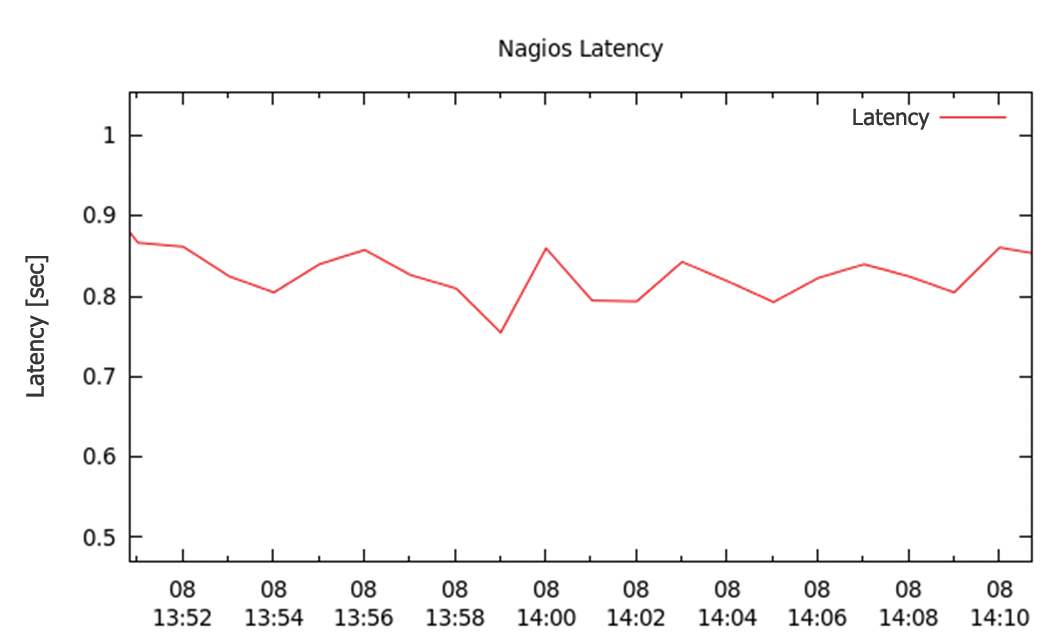
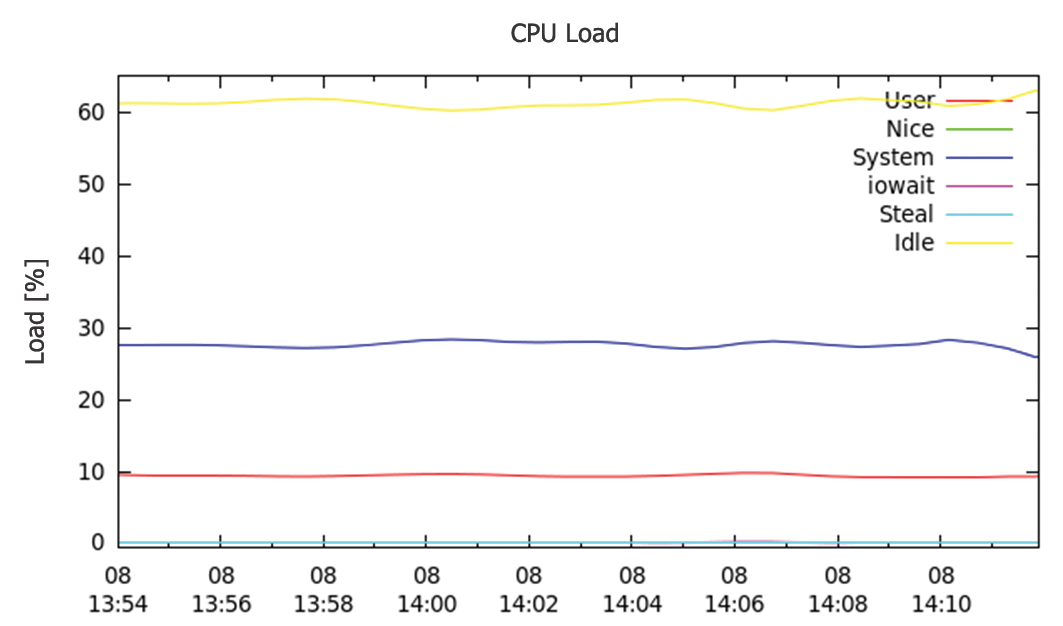
Running similar tests for Icinga and the Merlin broker module revealed unequivocal results: no major differences were revealed between them and the Nagios core. This comes as little surprise because Icinga and Merlin rely on a very similar codebase. The improvements made to Icinga have thus far had very little influence on improving performance. Merlin itself doesn't offer any performance benefits; its interest lies its horizontal scaling with the addition of more monitoring nodes. The increase in the CPU Load graph is far less pronounced for a Merlin system with two nodes because the load is automatically distributed over both nodes (data not shown).
Future
The results from these tests prompted me to join forces with Andreas Ericsson – one of the core developers in the Nagios project – in a search for the root cause of performance hang-ups. It turns out the reason for dramatically better performance with Shinken and mod_gearman is due to the way they hand over the check results to the Nagios core. In a legacy Nagios environment, the filesystem is used for this – the results are cached in a temporary directory; the core checks the directory at regular intervals and then loads the messages into the system. In contrast, communications in mod_gearman and Shinken are handed directly to the core without detouring via the filesystem.
Although Nagios is less complex than the other two candidates, the process of handing over the check results via the filesystem causes far more overhead than direct communications with the core. Mod_gearman and Shinken therefore have a clear advantage in terms of system performance in larger environments. The good news for Nagios users comes straight from Andreas Ericsson:
We're very well aware of where the bottlenecks in Nagios reside and the reason mod_gearman and Shinken both currently outperform vanilla Nagios. Fixing them is not hard. Fixing them so we gain a net benefit larger than the sum of its parts is the real trick, and the I/O broker combined with worker processes will do just that. The experimental code for Nagios runs 10,000 check in under five seconds. I know Shinken boasts 120K checks per five minutes, which we'll clearly outperform by a factor of 5.
