Debugging the Linux kernel with the Qemu emulator
Debugger
Some of the basic operations that a debugger supports include freezing code sequences and subsequently analyzing memory content. If the code sequences belong to an application, debugging is comparatively unproblematic, but if you freeze the kernel itself, you don't have a run-time environment that accepts keyboard input, outputs data to the monitor, accesses memory content, or continues running the kernel later on. You could almost compare kernel debugging with trying to operate on yourself.
From a technical point of view, this problem is solved by offloading complex functions to a second system, which will typically have working memory and file management and help you search the source code for variables, data structures, functions, and lines of code. This means you only need a debug server for the kernel that you want to debug; the server can execute simple commands, such as reading or writing memory cells or setting breakpoints, on the system under investigation.
The Qemu emulator has a built-in debug server (see the "Kernel Debugging Variants" boxout). If you also use the Buildroot [1] system generator, kernel debugging is comparatively simple to implement. The precondition for doing so is having a kernel with symbol information. This isn't an issue thanks to Buildroot: Within a short time, the tool can give you a clear-cut userspace and a lean kernel that you can quickly reconfigure and modify.
All of the steps in this approach are shown in the "Brief Guide to Buildroot" boxout. You can start by downloading Buildroot and unpacking the archive. Then, create the default configuration – preferably for an x86 system – by typing make qemu_x86_defconfig. You need to modify four options for the ensuing make menuconfig:
In Toolchain, enable the Build gdb for the Host option; in Kernel | Kernel version, type 3.2; in System Configuration | Port to run getty (login prompt) on, enter tty1; and for Build options | Number of jobs to run simultaneously, enter the number of cores in the generator machine.
Another make triggers the first generator run. This will create the kernel sources, among other things, but you will need to modify the configuration again for kernel debugging some time later.
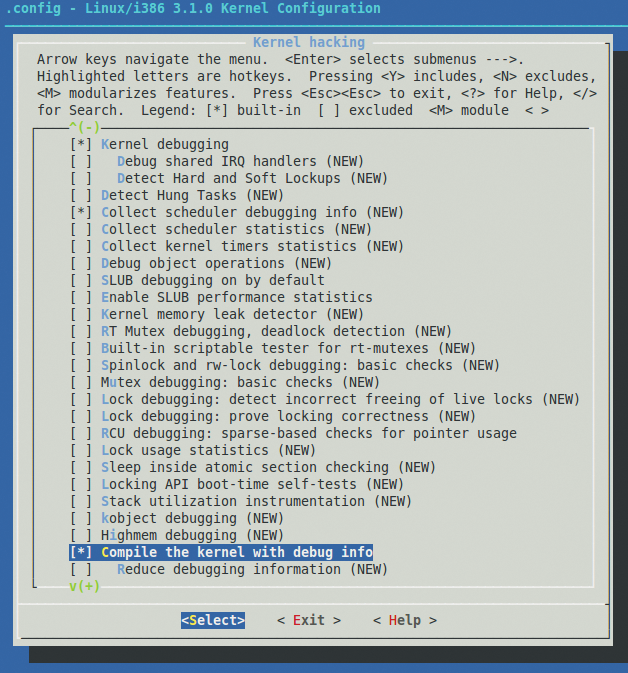
To do so, run make linux-menuconfig in the root directory of Buildroot. The relevant options in the menu that is subsequently displayed are located below the Kernel Hacking item (Figure 2). The Kernel debugging and Compile the kernel with debug info options are needed here. Another call to make generates a kernel with the modified configuration.

The results of this are basically two files: You will have a vmlinux that contains both the code and the corresponding debug information in the directory of the kernel source code. The architecture subdirectory – this is arch/x86/boot/ for the x86 platform – contains the compressed kernel in bzImage. Other platforms might call the kernel zImage. Bootloaders such as GRUB need the compressed kernel (bzImage). The debugger itself also needs the kernel image but will use the uncompressed counterpart vmlinux, which contains the debug info. Of course, the debugger also needs access to the source code.
Once you have generated the kernel and the root filesystem with Buildroot, you should first test both without debugging:
qemu -kernel output/images/bzImage -hda output/images/rootfs.ext2 -append "root=/dev/sda rw"
If everything works, you can start debugging by appending -s and -S:
qemu -kernel output/images/bzImage -hda output/images/rootfs.ext2 -append "root=/dev/sda rw" -s -S
The -s option launches the debug server (gdbserver), and -S stops the kernel at the outset.
Page Change
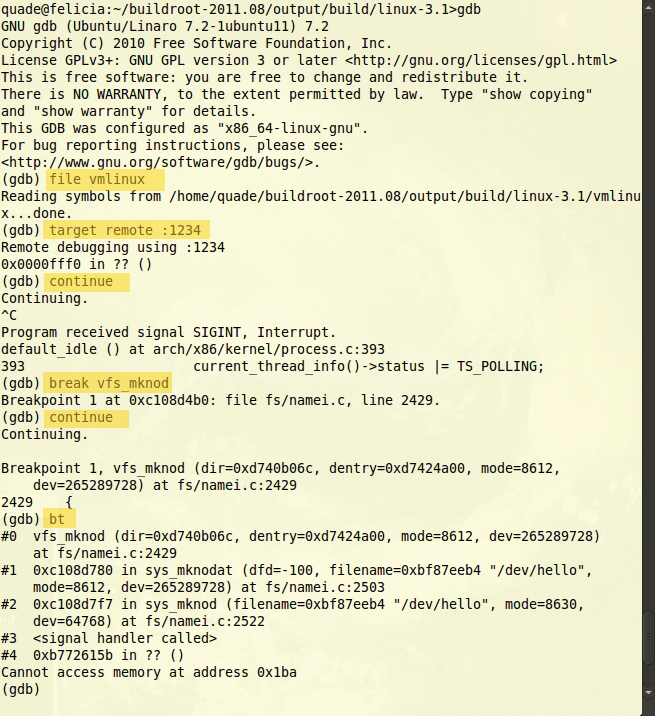
To help the GNU debugger (GDB) find the kernel C and header files, launch the tool in the Linux kernel source code directory (Figure 3). If you built an x86 system, you can deploy the GNU debugger preinstalled on the developer system; otherwise, use the GDB built for the host system, which resides in the Buildroot output/host/usr/bin/ directory:

cd output/build/linux-3.2/
gdb
The gdb command opens the debugger session. To start, load the kernel code and symbols with: file vmlinux. If you see a no debug-symbols found message, you need to check the debug options in your kernel configuration and possibly rebuild the kernel. Including the symbols, vmlinux weighs in at more than 40MB.
Next, open a connection to the debug server by typing target remote :1234 (Figure 3). The gdb command then handles the further course of execution (Table 1). The continue command enables the Linux guest system, and pressing Ctrl+C interrupts execution.
Tabelle 1: Important GDB Commands
|
Command |
Meaning |
|---|---|
|
|
Load additional symbol file |
|
|
Set breakpoint |
|
|
Output the call sequence for functions |
|
|
Continue program |
|
|
Delete breakpoint |
|
|
Log the debugger off the debug server |
|
|
Load code (program) |
|
|
Output information on the implemented functions |
|
|
Display various information |
|
|
Process code line |
|
|
Output variables, data structures, and memory cells |
|
|
Terminate GDB |
Figure 3 shows the GDB command break vfs_mknod setting a breakpoint for the vfs_mknod function; for kernel 3.2, use sys_mknod instead because of changes in the Linux kernel. When a user on the Linux system runs the mknod /dev/hello c 254 0 command, execution stops, and you can inspect the variables. To continue program execution, enter the continue command. To isolate the debugger from the Linux system, first press Ctrl+C, then issue the GDB detach command to interrupt the connection to the server; quit terminates the debugger.
To the Modules …
Kernel modules can also be debugged at the programming language level with Qemu, but to do this, you need to activate Enable loadable module support in the submenu Module unloading. In other words, this process means reconfiguring and regenerating the kernel that you created with Buildroot. Because it is also impossible to predict the module code's address in main memory, you need to load the module, find the address, and tell the debugger. You need to check the /sys filesystem entries to do so, but more on that later.
Before debugging, first generate the module for the kernel created with Buildroot. The easiest way to do this is use a modified Makefile by pointing the KDIR variable to the path with the kernel sources you are using, which will be below the Buildroot root directory in this case. If the Linux system in Qemu that you are debugging is not designed for an x86 architecture, you need to set the CROSS_COMPILE and ARCH environment variables.
To debug the module, you need to have Listing 1 as your Makefile and Listing 2 as hello.c in a separate folder below the Buildroot root directory. Also, you might need to modify the path to the Linux sources in the KDIR variable. The modified Makefile builds the hello.ko module, which you can then copy to the root filesystem using, for example:
Listing 1: Makefile
01 ifneq ($(KERNELRELEASE),)
02 obj-m := hello.o
03
04 else
05 PWD   := $(shell pwd)
06 KDIR  := ~/buildroot-2011.08/output/build/linux-3.1/
07
08 default:
09          $(MAKE) -C $(KDIR) M=$(PWD) modules
10 endif
11
12 clean:
13         rm -rf *.ko *.o *.mod.c *.mod.o modules.order
14         rm -rf Module.symvers .*.cmd .tmp_versions
Listing 2: Module hello.c
01 #include <linux/fs.h>
02 #include <linux/cdev.h>
03 #include <linux/device.h>
04 #include <linux/module.h>
05 #include <asm/uaccess.h>
06
07 static char hello_world[]="Hello World\n";
08 static dev_t hello_dev_number;
09 static struct cdev *driver_object;
10 static struct class *hello_class;
11 static struct device *hello_dev;
12
13 static ssize_t driver_read( struct file *instanz,char __user *user, size_t count, loff_t *offset )
14 {
15    unsigned long not_copied, to_copy;
16
17     to_copy = min( count, strlen(hello_world)+1 );
18     not_copied=copy_to_user(user,hello_world,to_copy);
19     return to_copy-not_copied;
20 }
21
22 static struct file_operations fops = {
23     .owner= THIS_MODULE,
24     .read= driver_read,
25 };
26
27 static int __init mod_init( void )
28 {
29     if (alloc_chrdev_region(&hello_dev_number,0,1,"Hello")<0)
30         return -EIO;
31     driver_object = cdev_alloc();
32     if (driver_object==NULL)
33         goto free_device_number;
34     driver_object->owner = THIS_MODULE;
35     driver_object->ops = &fops;
36     if (cdev_add(driver_object,hello_dev_number,1))
37         goto free_cdev;
38     hello_class = class_create( THIS_MODULE, "Hello" );
39     if (IS_ERR( hello_class )) {
40         pr_err( "hello: no udev support\n");
41         goto free_cdev;
42     }
43     hello_dev = device_create( hello_class, NULL, hello_dev_number, NULL, "%s", "hello" );
44     return 0;
45 free_cdev:
46     kobject_put( &driver_object->kobj );
47 free_device_number:
48     unregister_chrdev_region( hello_dev_number, 1 );
49     return -EIO;
50 }
51
52 static void __exit mod_exit( void )
53 {
54     device_destroy( hello_class, hello_dev_number );
55     class_destroy( hello_class );
56     cdev_del( driver_object );
57     unregister_chrdev_region( hello_dev_number, 1 );
58     return;
59 }
60
61 module_init( mod_init );
62 module_exit( mod_exit );
63 MODULE_LICENSE("GPL");
cp hello.ko ../output/target/root/
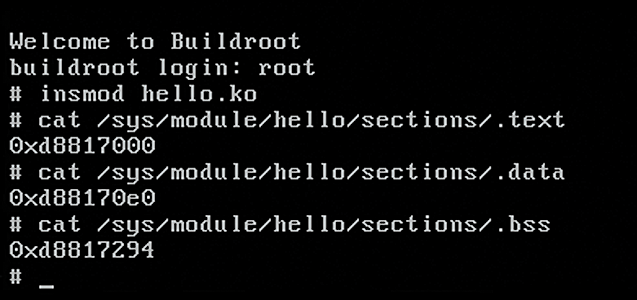
A call to make in the Buildroot directory regenerates the root filesystem. This puts the module in the superuser's home directory after booting. The easiest approach is to omit the -S option but use -s when you call Qemu. This enables the debug server, but Linux still boots directly. After logging in as root, you can load the module by issuing the command insmod hello.ko (Figure 4).

The following commands determine addresses for the code segment and the two data segments:
# cat /sys/module/hello/sections/.text
# cat /sys/module/hello/sections/.data
# cat /sys/module/hello/sections/.bss
Because the Linux system generated by Buildroot doesn't include udev support, you also need to issue the mknod /dev/hello c 254 0 command to create the device file, which an application would use to access the driver in this example. You can discover whether the system uses the major number 254 by typing
cat /proc/devices | grep Hello
Next, launch GDB on the host system in the normal way from the Linux kernel source directory. After you type the file vmlinux and target remote :1234 commands, Qemu stops the Linux system. The following command tells the system the hex address of the code segment and the two data segments:
add-symbol-file path/hello.ko 0xd8817000 -s .data 0xd88170e0 -s .bss 0xd8817294
Now you can set a breakpoint, for example, for the driver_read function. The continue command tells the Linux system to go back to work.
If you now enter the cat /dev/hello command in the terminal of the system you are debugging, driver_read is enabled and GDB stops the kernel at the breakpoint you set previously. You can now investigate the module's memory cells and step through its process.
Clever
It can be confusing to see the debugger jump about between the lines of code, seemingly without any motivation. Access to the local variables explains the reason for this: value optimized out – the compiler has optimized the kernel code. This means that some of the defined variables are invisible in the debugger; code fragments have been remodeled. Because a number of macros are in use in the kernel, troubleshooting doesn't become any easier, either. In many cases, a variable turns out to be a clever macro.
Kernel debugging thus continues to be a challenge that you need to face with much patience and practice.
