TKperf – Customized performance testing for SSDs and HDDs
Stopwatch
Solid State Drives (SSDs) have grown beyond their status as a niche product and now increasingly compete with traditional hard disk drives (HDDs) as an attractive option for server systems in terms of capacity and price. Whether SSDs really do boost performance depends on the particular application, because the requirements placed on the storage systems can differ fundamentally. Users must first decide on SSDs, HDDs, or a combination of the two technologies. Once you've decided which medium to use, you still need to choose an appropriate model.
Test for Yourself
To begin, you will want to make sure that the speed of the selected hardware meets your current and future performance requirements. Meaningful and transparent performance tests considerably facilitate your search for the right SSD or HDD. From the perspective of the end user, the more information a test delivers, the more valuable it is. Often the manufacturer's performance specifications are not authoritative, because neither the software used nor the test method is specified.
The Storage Networking Industry Association (SNIA) has released the "Solid State Storage Performance Test Specification," a document that provides a specific test description for SSDs in the enterprise space [1]. In its tests, the specification specifically targets the unique properties of SSDs and describes the approach to achieving accurate and reproducible results. TKperf, an open source tool developed by Thomas-Krenn.AG, implements this specification and prepares the results in a test report [2]. In addition to testing for SSDs, some initial basic tests for hard disks are also available; they will be expanded in future versions of TKperf.
Fio and Python
In the background, TKperf uses the Flexible I/O Tester (Fio) [3] developed by Jens Axboe, the maintainer of the Linux block layer. Fio offers many options and the flexibility to implement the SNIA performance tests: Features include run-time limits, direct I/O, number of parallel jobs, I/O depth, or the use of non-compressible test data.
TKperf requires Fio 2.0.3 or higher. In older versions of Fio, some terse output information is missing; this is minimal output that can be easily processed by other programs [4]. Distributions like Ubuntu 12.04 or Debian squeeze have older Fio versions in their repositories (v1.59 or v1.38), but Fio can be compiled easily from the source code in the Git repository [5].
Other components of TKperf rely on the hdparm utility and Python. Hdparm uses hdparm -I to provide automated information about a device under test. The tool can also perform a secure erase on SATA drives. For SSDs, this means that all flash chips are erased, thus restoring the SSD's as-received condition performance. Secure erase, which is a key part of the initialization phase of the tests, is also the reason why some manual attention is still needed when testing SAS or PCIe SSDs.
For SAS devices, you need to modify the sg_format secure erase method in sg3_utils (the tools for executing SCSI commands). Secure erase is even more complicated for PCIe SSDs because they require vendor-specific, command-line tools. For Intel's PCIe SSD 910, for example, you need to launch secure erase via the isdct Datacenter tool.
The Python scripts in TKperf start the Fio jobs, prepare the results, and generate charts. All Fio calls are recorded in a logfile. At the end of a test, the test results are also logged. The logged performance values are stored in XML format and used to create the charts. With the help of the Python Matplotlib library, TKperf generates the graphical representations of the results required by the specification [6].
TKperf Test Scenarios
A bandwidth test, an input/output operations per second (IOPS) test, a latency test, and a saturation test are all available for SSDs. Listing 1 shows the output of TKperf during testing of an Intel DC S3700 200GB SSD.
Listing 1: TKperf Result Set
$ sudo tkperf ssd intelDCS3700 /dev/sdb -nj 2 -iod 16 -rfb
!!!Attention!!!
All data on /dev/sdf will be lost!
Are you sure you want to continue? (In case you really know what you are doing.)
Press 'y' to continue, any key to stop:
y
Starting SSD mode...
Model Number:       INTEL SSDSC2BA200G3
Serial Number:      BTTV241303MG200GGN
Firmware Revision:  5DV10206
Media Serial Num:
Media Manufacturer:
device size with M = 1000*1000:      200049 MBytes (200 GB)
Starting test: lat
Starting test: iops
Starting test: writesat
Starting test: tp
The bandwidth, IOPS, and latency tests show some similarities that are reflected in the graphics. All of these tests are performed in rounds, with measurements taken in each round. Taking into account a dependent variable, the test calculates whether the SSD is in a stable state. This approach avoids influencing the measurements in a "fresh out of the box" state or undefined transitions between different workloads. Only if the values of the dependent variable are stable over the last several rounds the values of this measurement window are incorporated into the test results.
IOPS Measured
Using an IOPS measurement as an example, the following sections illustrate the test sequence from secure erase, through assessment of the steady state, to representation of the results. First, a definition of terms significant for the rounds-based tests:
- Dependent Variable: This is necessary to check whether a stable state has been reached. This variable is defined by the specification and consists of a combination of workload and block sizes. For the IOPS test, this variable is equal to the IOPS achieved in a random write with a block size of 4KB.
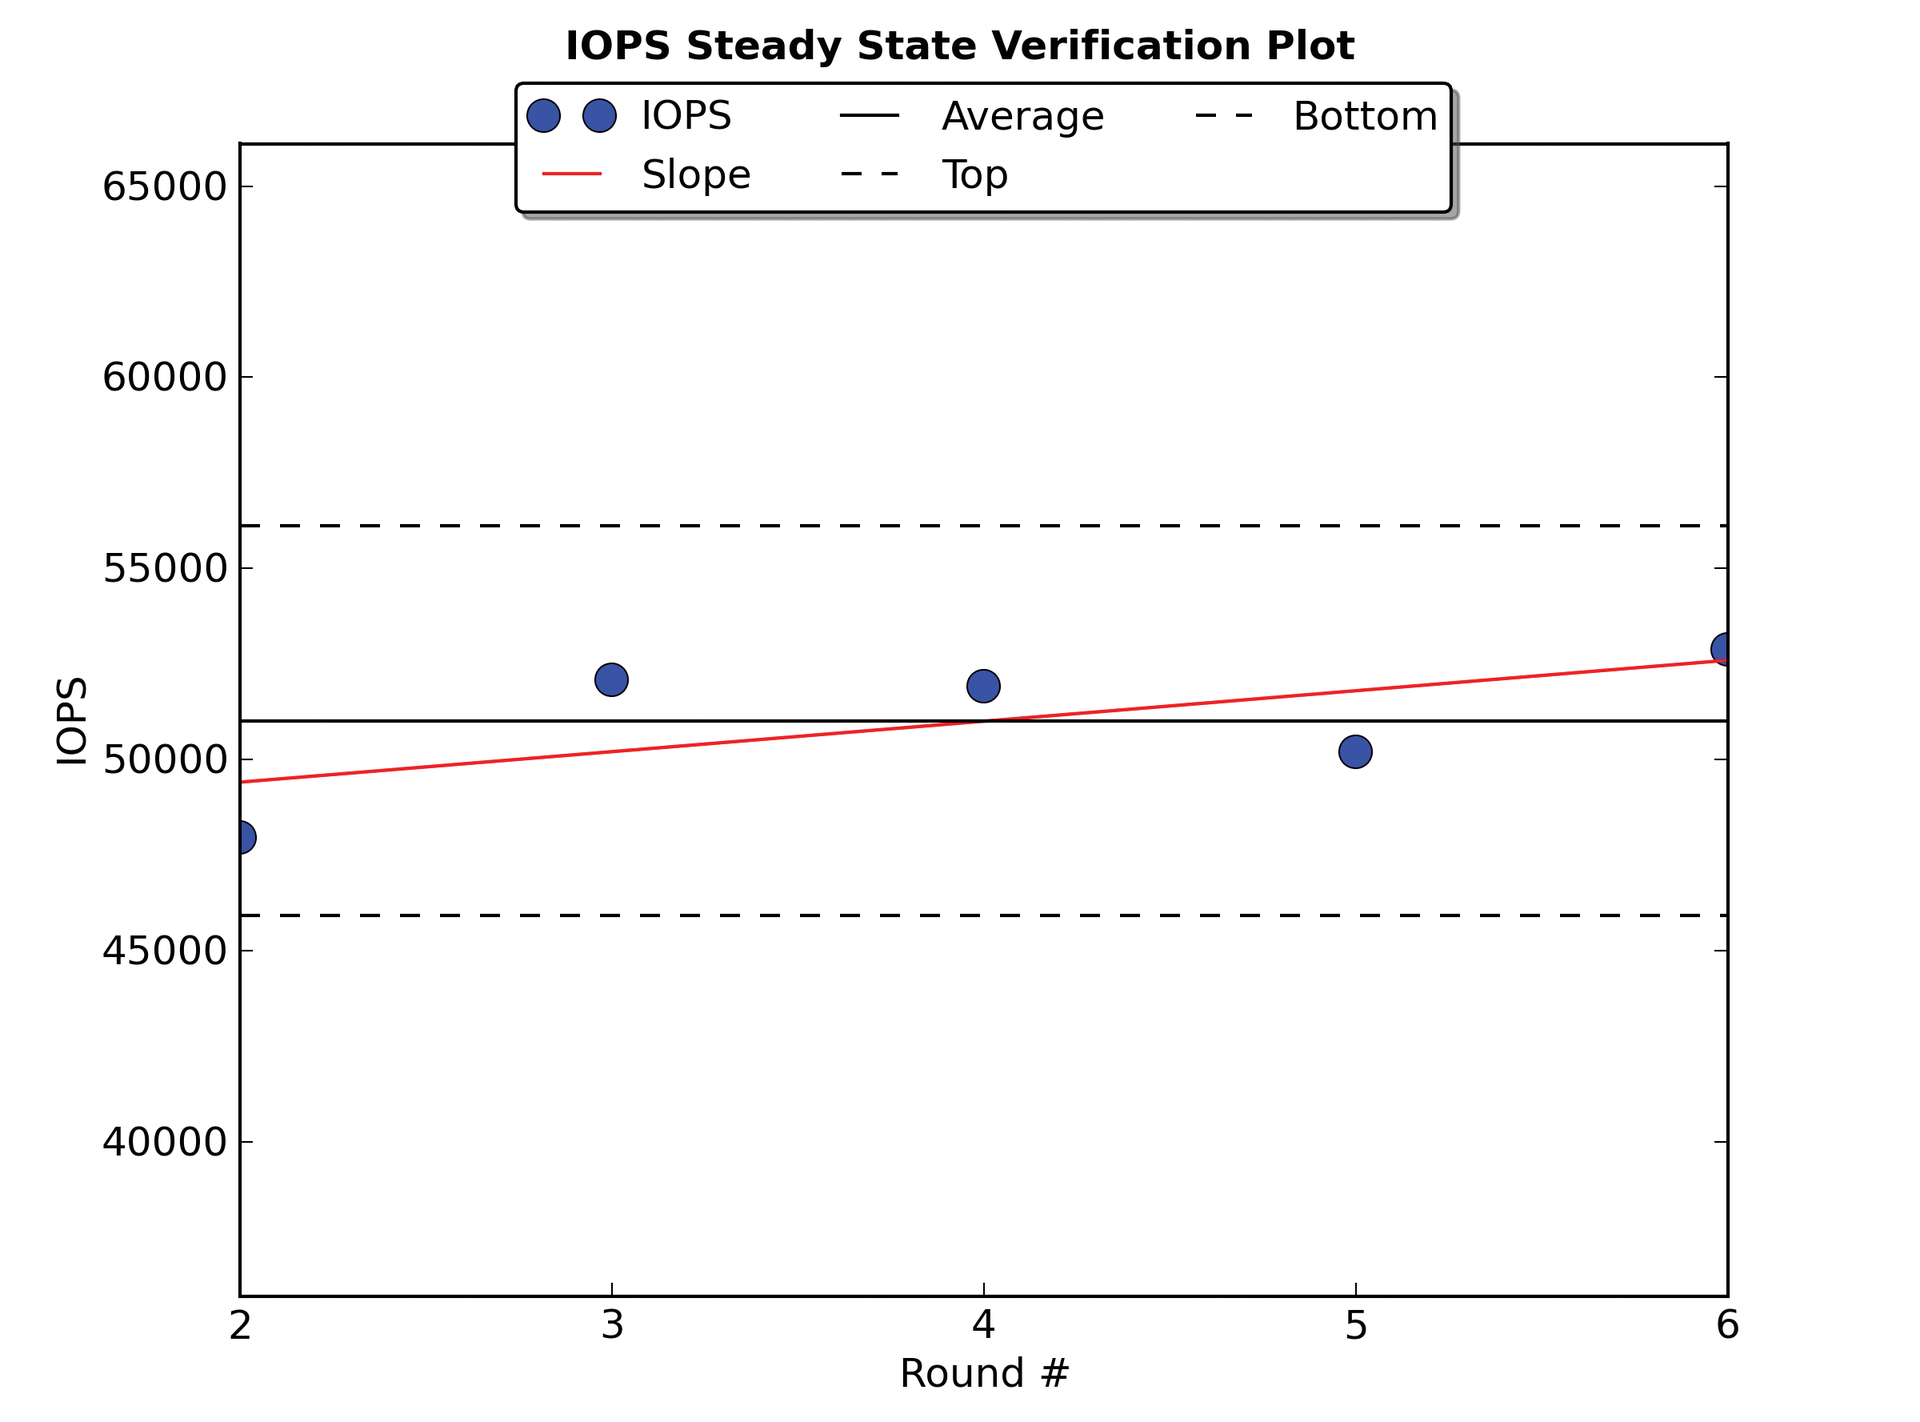
- Steady State: This is the state in which the last measured values do not differ significantly from one other. The parameters for deciding whether or not the steady state has been reached are the gradient of the straight line predicting the next value and the difference between the largest and smallest measured value. The measured values of the previous five rounds are used as reference variables for the steady state. The steady state verification plot shows the evolution of the dependent variable and proves that the SSD is in a stable state (Figure 1). The pseudo-code of the IOPS test illustrates which operations are carried out in a round (Listing 2).

Listing 2: Pseudo-Code of the IOPS Tests
01 Make Secure Erase
02 Workload Ind. Preconditioning
03 While not steady state
04     For workloads [100, 95, 65, 50, 35, 5, 0]
05         For block sizes ['1024k', '128k', '64k', '32k', '16k', '8k', '4k', '512']
06             Random Workload for 1 Minute
In detail, the steps mean:
1. A secure erase guarantees that the SSD is in a defined state.
2. For preconditioning, the device is overwritten twice (sequential access with a 128KB block size).
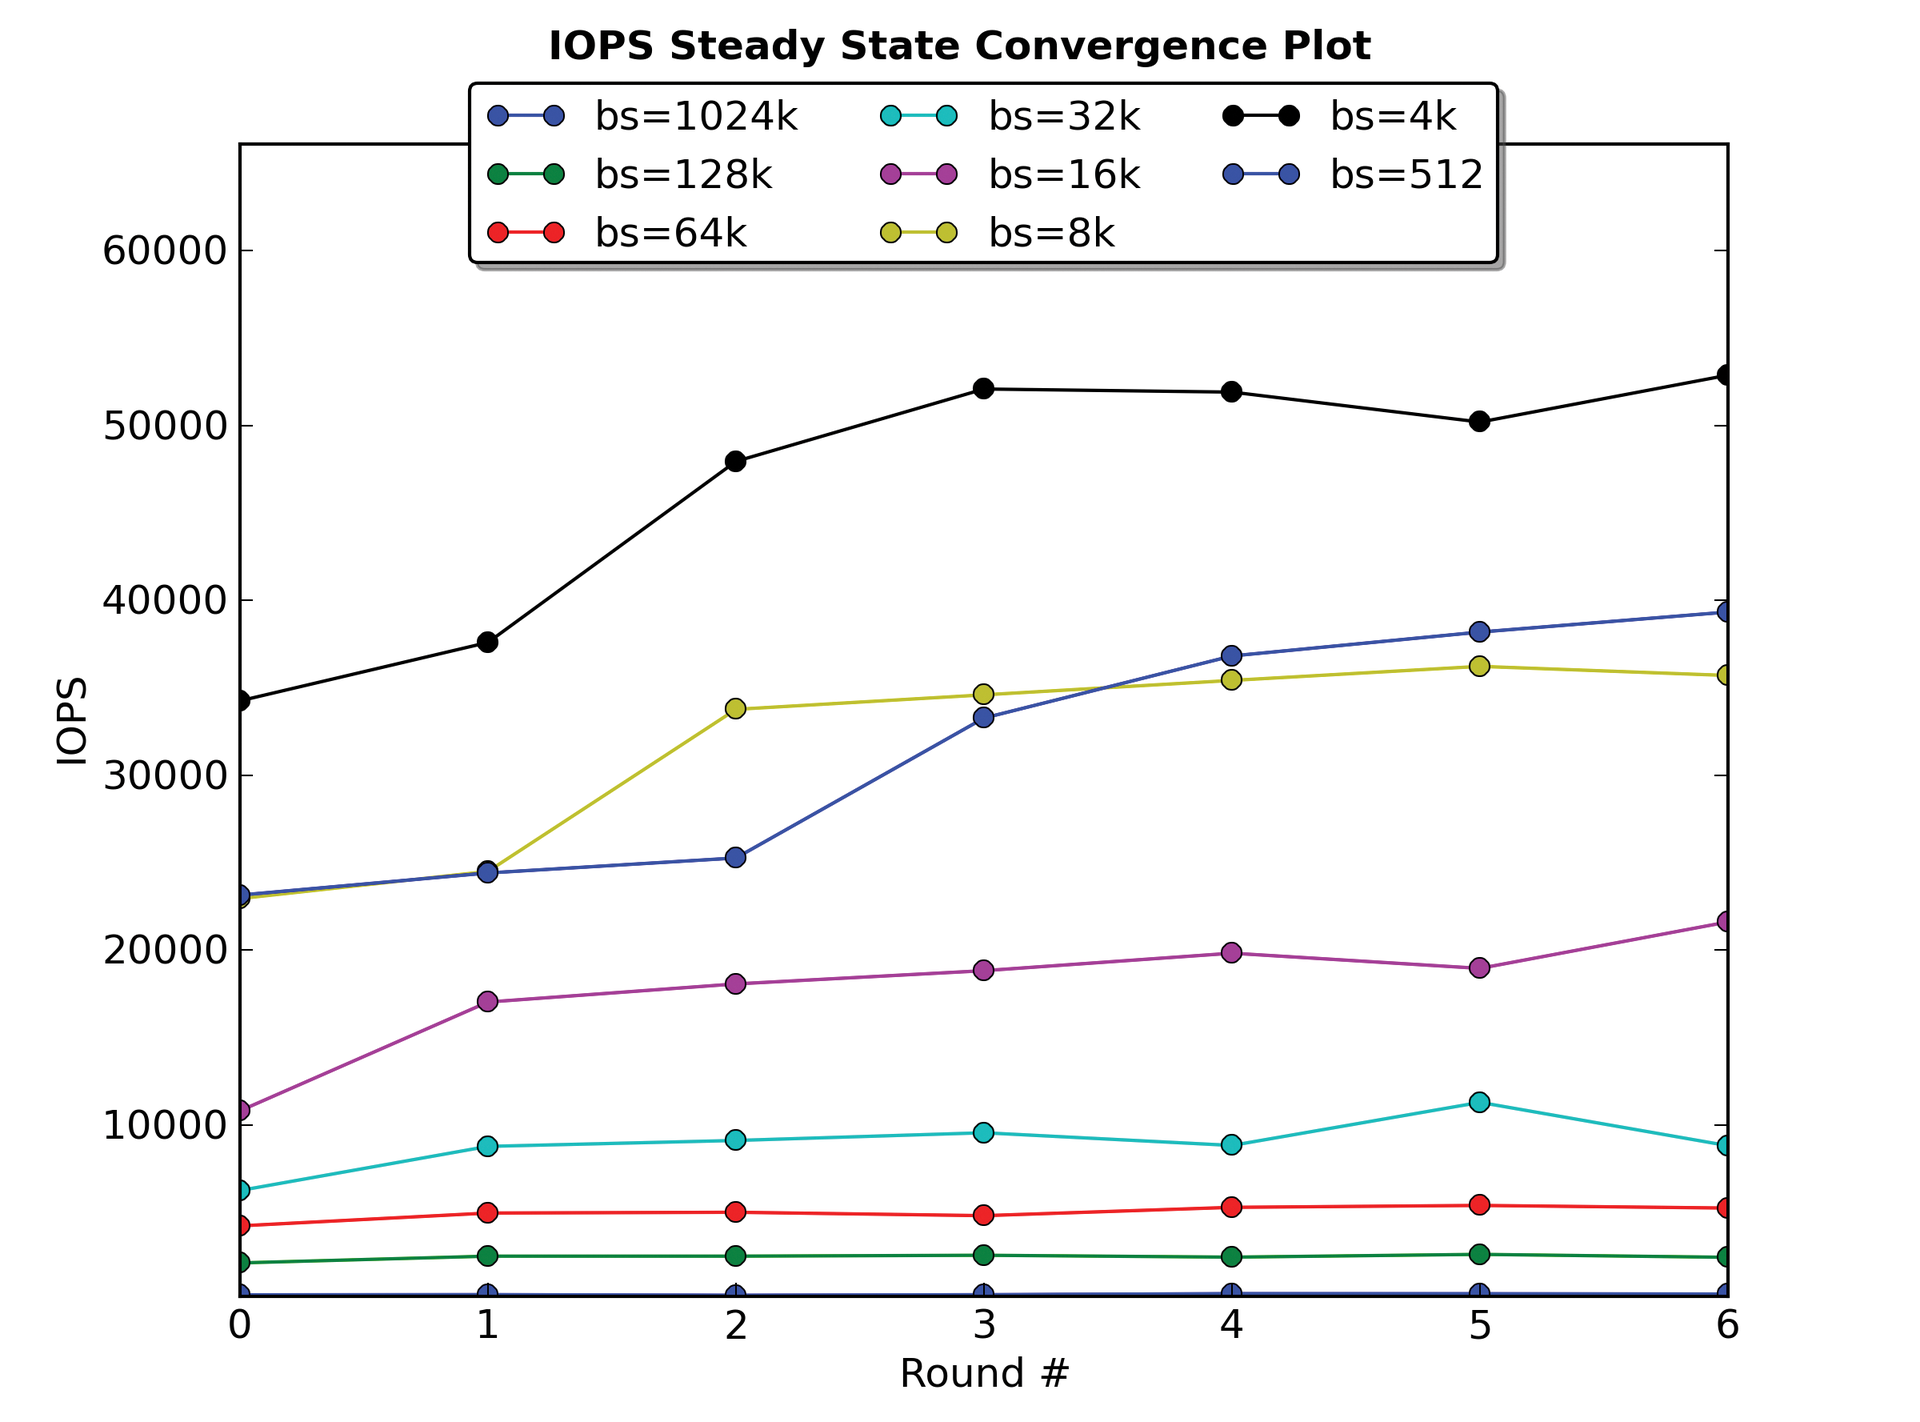
3. Until steady state is reached, various combinations of block sizes and mixed workloads are started in each round. A workload of 100 means 100 percent reads, 95 stands for 95 percent read and 5 percent write access, and so on. Random access (random I/O) is always used for the IOPS test. As the dependent variable, IOPS with 4KB block size are used for writing. The steady state convergence plot shows the evolution of all block sizes (including the dependent variable) for random writing (Figure 2).

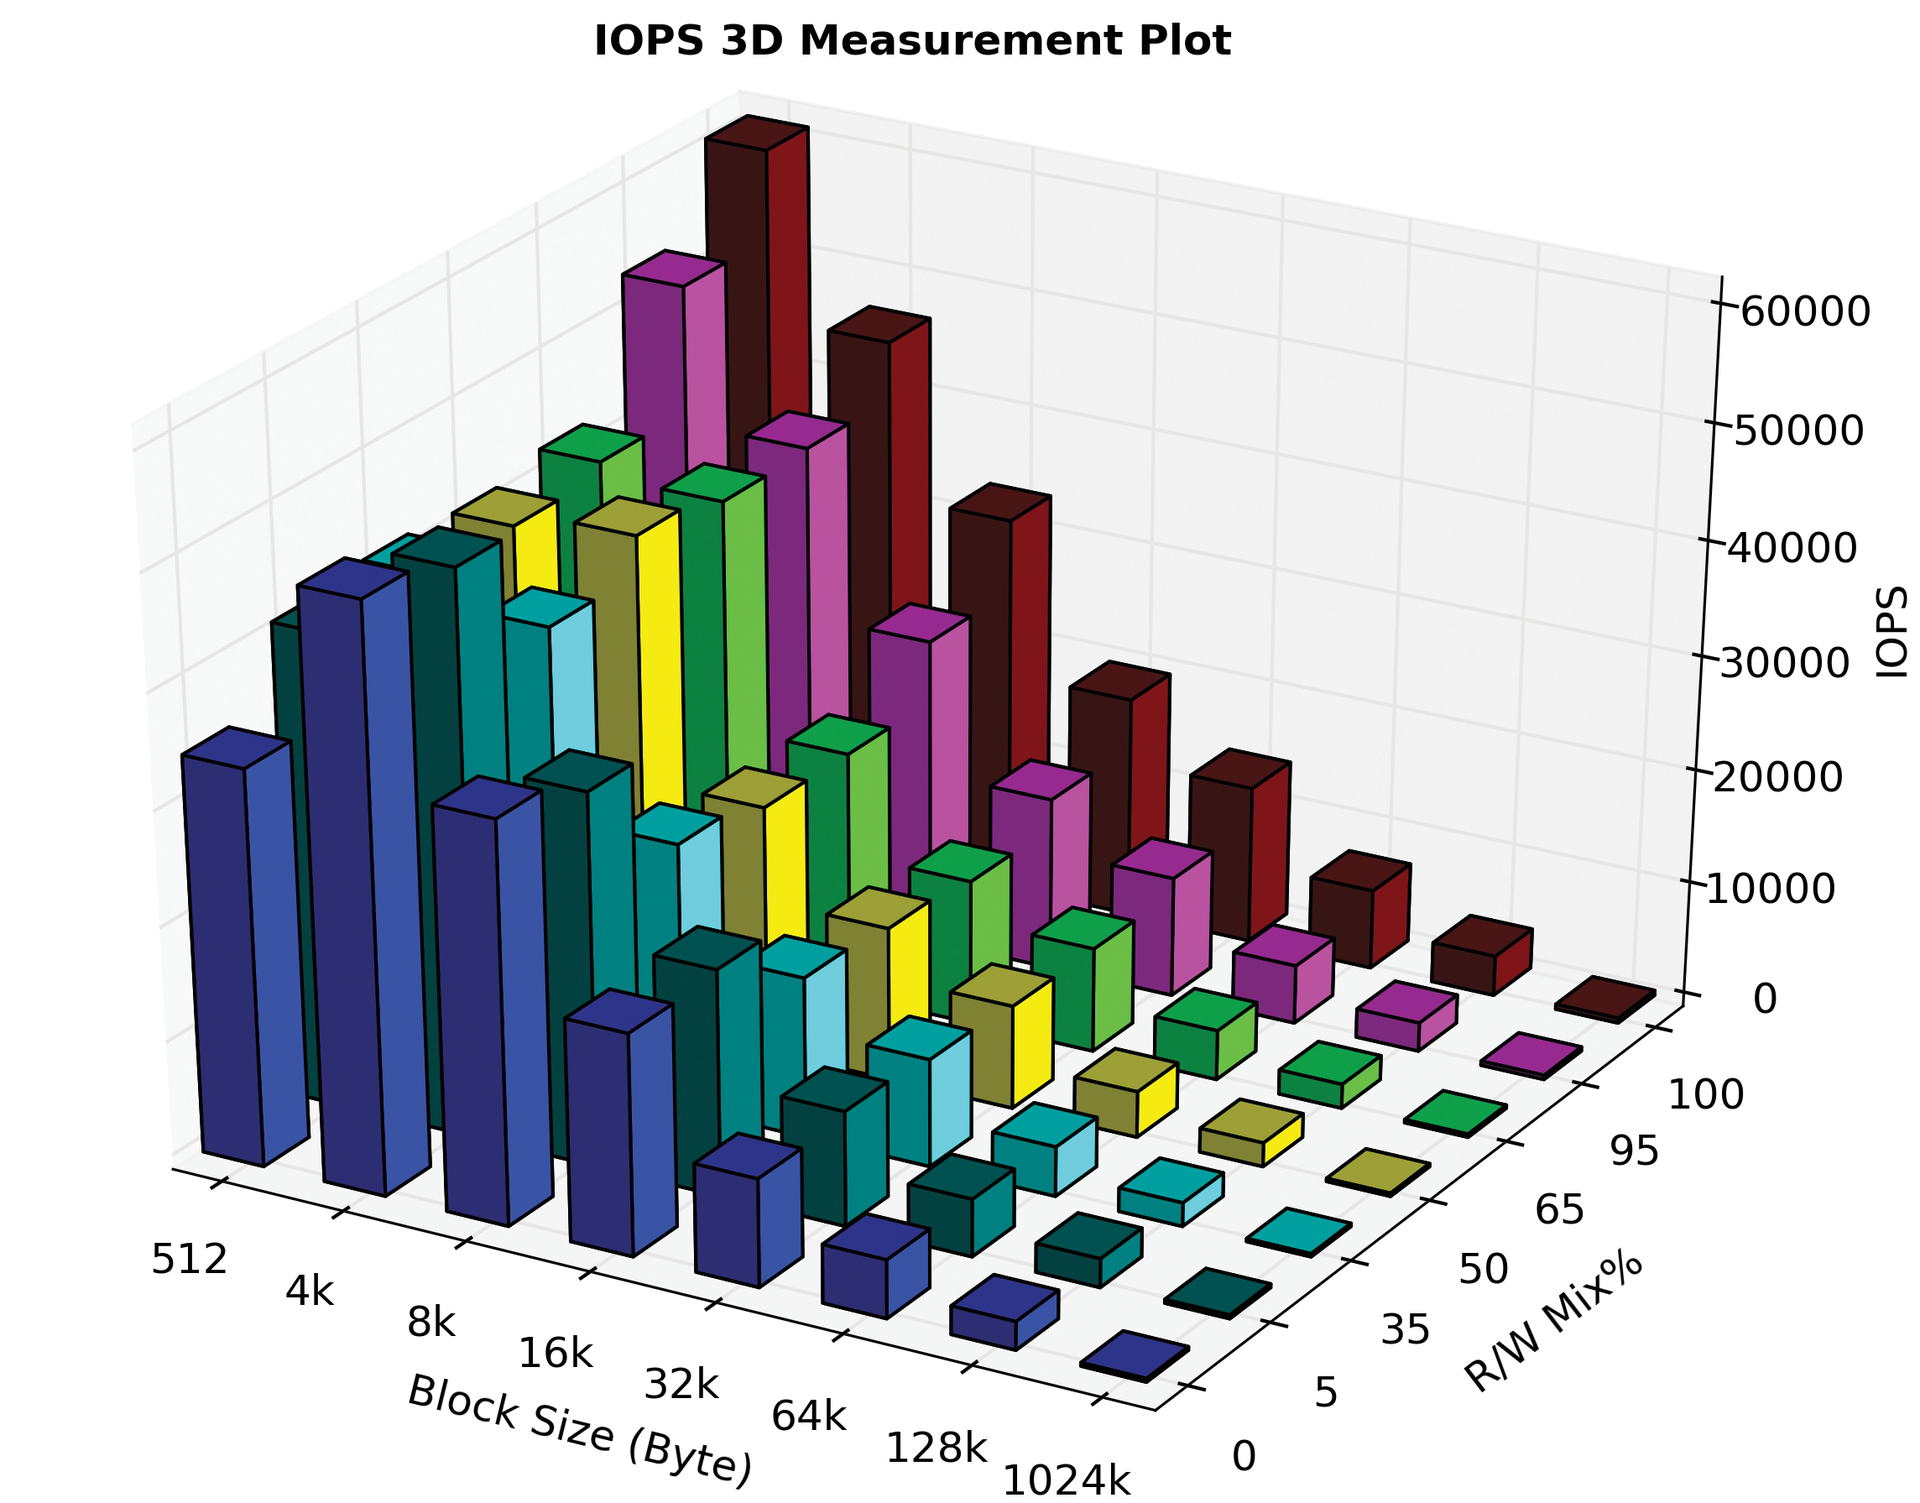
If the device is in a stable condition, the test is terminated and the measured values are processed for creating charts. To do this, TKperf computes the mean value in the measurement window for the measured variables (workload and block sizes). The measurement plot represents the collated computed values (Figure 3).

The previous example of the IOPS tests showed the basic sequence in which the results are determined. For the bandwidth and the latency tests, other workloads, block sizes, and dependent variables apply (see Table 1).
Tabelle 1: Bandwidth and Latency Test Parameters
|
Test |
Workloads |
Dependent Variable |
Block Sizes |
|---|---|---|---|
|
Bandwidth (throughput) |
Sequential: 100 (read only), 0 (write only) |
1024KB, 64KB, 8KB, 4KB, 512 bytes |
Sequential write with 1024KB block size |
|
Latency |
Random: 100, 65, 08 |
8KB, 4KB, 512 bytes |
Random write with 4KB block size |
A Special Case: Write Saturation
The write-saturation test is not aimed at achieving a stable state, but it needs a minimum amount of data written to the device. The test shows how an SSD behaves in continuous writing with random access. In terms of the volume of data written, care is taken to ensure that it is a multiple of the device size.
Although this test is also rounds-based, a dependent variable to elicit a steady state does not exist. In each round, TKperf randomly writes to the device with a 4KB block size. It keeps track of how many bytes were written to the device in a minute (one round), and the tool adds the number of bytes per round. The end of the test is reached when this number becomes greater than four times the size of the device. A second termination condition is a time limit: After 24 hours running time the test also ends. Figure 4 illustrates the aim of this test, which reveals the stability of the SSD during extended writing with random access.

For Hard Disk Drives
TKperf adapts the rounds-based system for hard drives; however, stable state detection is not meaningful for HDDs. Instead, the software takes into account the difference in performance at the beginning and end of a HDD. Because HDDs are written to from the outside in, shorter access paths of the read/write head lead to better performance, and faster track speeds lead to improved performance. For the hard drive test, TKperf therefore divides the device into 128 equal parts, which are tested separately. For determining throughput, it reads or writes to the entire area once. To measure IOPS, it randomly accesses data in a given section for one minute. This procedure illustrates the performance development of the hard disk when running through the sectors from the outside to the inside.
Conclusions
This article has shown how TKperf addresses the special characteristics of SSDs in performance tests based on the SNIA specification. Several parameters affect the speed of SSDs, so certain processes are needed to achieve defined output levels and test results [7]. The key parts of these procedures include a secure erase, workload-independent preconditioning, and a review of whether the SSD is in a stable state. For testing hard disks, TKperf offers basic tests for measuring throughput and IOPS.
Performance tests are implemented with the help of Fio. Python scripts generate graphs and a detailed PDF report. Tested devices are thus easy to analyze and compare with other models.
The complete report mentioned at the beginning for the Intel DC S3700 can be found online [8].
