Network monitoring with Total Network Monitor
Child's Play
Administrators who have still not deployed a professional monitoring solution for servers and network devices should take a look at Total Network Monitor (TNM), free network monitoring software that can help admins monitor servers, network devices, and individual processes or services in detail. For servers, you can create one specific "monitor" object or multiple monitors and perform actions, such as sending mail, executing scripts, and restarting services.
The setup is simple, and the tool is more powerful than it seems at first glance. The installation file for TNM can be downloaded from the Softinventive Lab website [1], and registration is not needed. After installing the package on a computer or server, you can get started. The tool supports up through Windows Server 2012 and Windows 8.
No Agents
Installing agents on endpoints is not necessary. The tool not only checks whether certain servers respond to ping requests, but it also can monitor individual services running on servers, event viewer logs, processes, and much more.
When launched, the tool displays the status of the current PC. On the left side are the connected devices; the next pane to the right shows the monitored services; at the bottom, any messages and errors from connected systems appear. You can extend monitoring to other devices after the install.
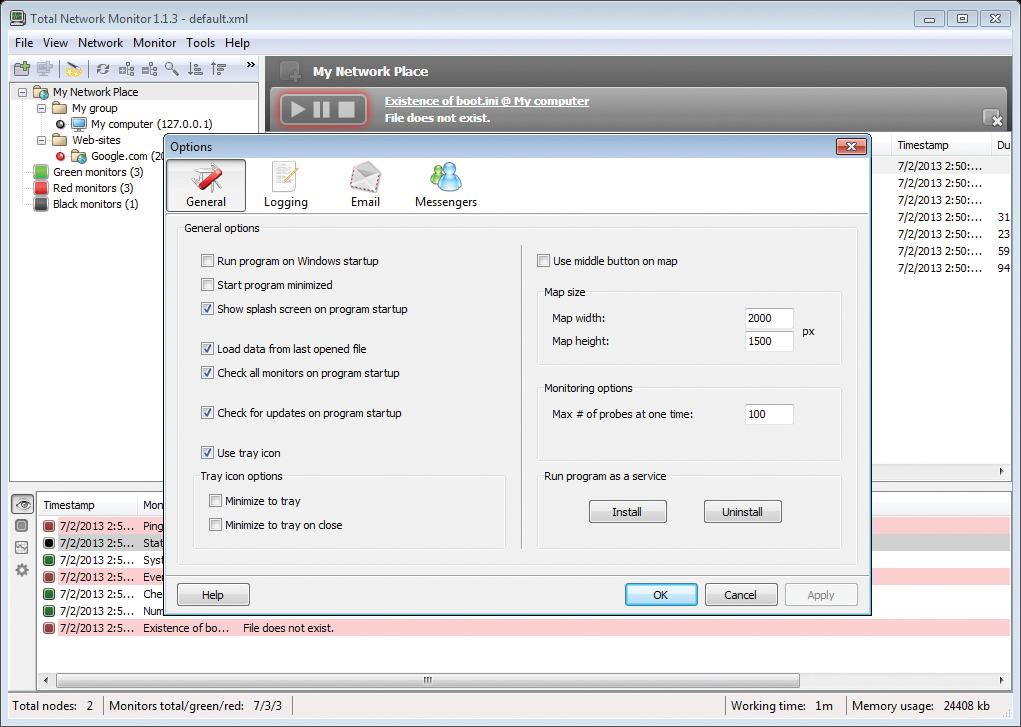
The File | Properties menu item takes you to the basic settings (Figure 1). For example, you can set up the program as a system service that starts automatically at every reboot. Various other tabs configure other settings that are self-explanatory. Total Network Monitor can also send email alerts. To do this, you define an SMTP server and login credentials. If you use a compatible instant messaging program, you can send messages via Jabber.

When you first begin, delete the default groups on the left and use the folder icon top left to create a new group. For a better overview, you can combine monitored devices into groups, which it displays as a folder in the left pane.
The View | Map function lets you create a map of connected devices and arrange your equipment to provide a good overview. In map view, you can also add or remove devices, just as in the normal tree view.
Integrating Servers and Services
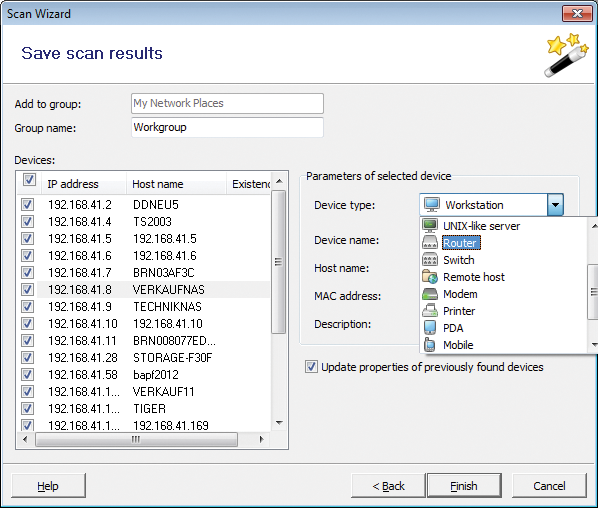
To monitor servers and services, start the device integration wizard via Tools | Scan Wizard or press the button with the wand tool (Figure 2). Next, click the plus sign that appears at the bottom of the list window on the left and enter the IP range you want the tool to scan. After clicking Next, TNM scans the network for devices. It then displays the devices it discovered. On the right, you can specify the device type for each device found. Uncheck the devices you do not want to monitor.

You can create separate groups for the devices found, add all of the devices to one group, or divide the devices among groups. After integrating a device, TNM automatically creates a monitor for each device that lets you keep an eye on the device or server.At this point, you can already see whether the devices are responding to pings.
Besides automatic integration, you can also enter servers manually via the context menu of a group. Start by creating folders to which you will be adding devices by entering the device name, type of device, and IP address in the window. Select the monitors in the middle and then either click the Play icon or select Check now/Run from the context menu.
Once you have integrated a device manually, you can use its context menu to create a new monitor. First start by managing the name and description in the Common tab. In the Probe tab you can specify the number of retries, the TTL, and the packet size with which to ping the device. Actions lets you choose how TNM reacts if the monitor reports an error, but to do so, you first need to create some actions.
As the first step, integrate the servers you want to monitor, and only then configure the actions. Later, I'll go over the details of creating actions and cloning monitors, as well as comprehensive server monitoring.
First Monitoring Steps
Once the individual devices have been integrated, you will see an overview of the network and its components. Active servers are marked on the left with a green box; problem cases are displayed in red, and if a device cannot be found, TNM displays a black box.
On the left-hand side, you can press the icon to view all faulty devices. At the bottom of the window, the program outputs messages if something is not working, along with a summary of all monitored nodes and memory consumption of the tool.
If you need more in-depth monitoring, you can now add additional monitors for individual devices, and you can create multiple, different monitors for all integrated devices in all groups. If desired, you can later define actions for the monitors. All of this is optional and can be added gradually.
The context menu of the monitors also lets you pause monitoring (e.g., to perform maintenance tasks). To add an additional monitor, right-click the appropriate device on the left-hand side and select Add monitor.
Different Monitors
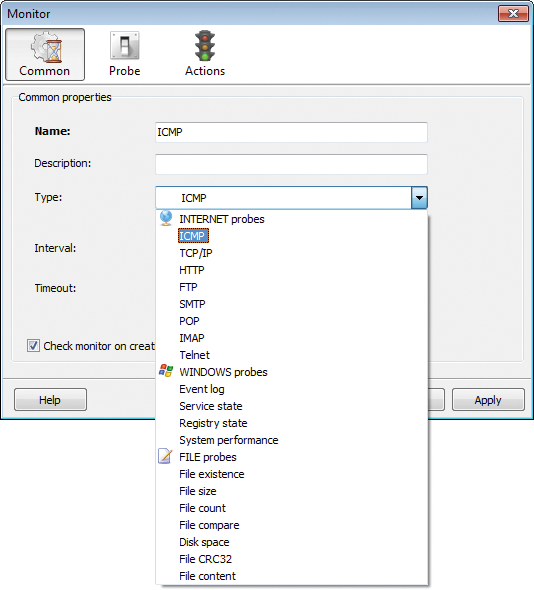
In the new window, first select the Type of monitoring you want to perform. For example, you can monitor the Event Viewer on Windows servers. Next, you need to click on the other tabs of the Monitor dialog to add data such as the login credentials for the server. In this way, you can create multiple monitors that each check the event viewer for specific messages and output warnings accordingly, or even send notifications or trigger other actions.
After you have created a monitor, you can start and terminate it via the context menu. At any time, you can change the settings and add actions. Total Network Monitor supports a huge set of protocols and actions [2] (Figure 3). In this way, you can also query websites, Outlook Web App, intranet sites, and SharePoint libraries.

Monitoring System Performance
In addition to system service failures and errors, you can create objects that let you monitor a server's performance. For this to happen, choose the new System performance monitor in the WINDOWS probes section, then use the Probe tab to define the values you want to monitor in terms of system performance parameters, such as CPU, memory, processes, and registered users.
You can also specify multiple monitors and configure a server to report a green status below a certain threshold and a red status at a different threshold. The TNM design puts virtually no limits on what you can do here. Many monitors and related actions require authentication. The Authorization tab handles this process.
Firewalls
When a monitor or an action cannot connect to the server, the failure is often attributable to the firewall settings. To allow this kind of monitoring on Windows, you need to run wf.msc and create appropriate rules or change the defaults in Windows Control Panel. More specifically, you need to allow remote administrative access. On the computer on which you have installed TNM, start the wmimgmt.msc console and try to connect to the target computer.
Creating and Assigning Actions
Total Network Monitor also can perform various actions when a monitor assumes a defined state. These actions are created centrally in the program and then are assigned to individual monitors. To create a new action, just right-click any monitor (or set of monitors) in TNM and select Add action. In the new window, you can specify a name for the action and the type of action. Various options are available.
You can view messages, maintain logfiles, play a sound, run applications and scripts, restart a server, send email and instant messages, add entries to the server's event viewer, and restart services. In the Common tab of the Action dialog, you specify the state that triggers the action. Depending on the selected action, you might need to fill out other fields, or you might see more tabs that need entries.
Total Network Monitor lets you specify how many time(s) in a row the action should be executed while the monitor has a defined status.
In Action
After creating an action, it is then associated with the corresponding monitor, which you can see in the Actions tab of the Monitor dialog. Here, you can Test any of the actions in the list to see whether they work. This approach lets you define actions on all connected servers and the monitors you created, but they are optional.
The settings for the monitored devices and all monitors and actions are saved in a project file in XML format with File | Save project. The XML file can be edited with a text editor or some other XML editor.
Project Data in XML
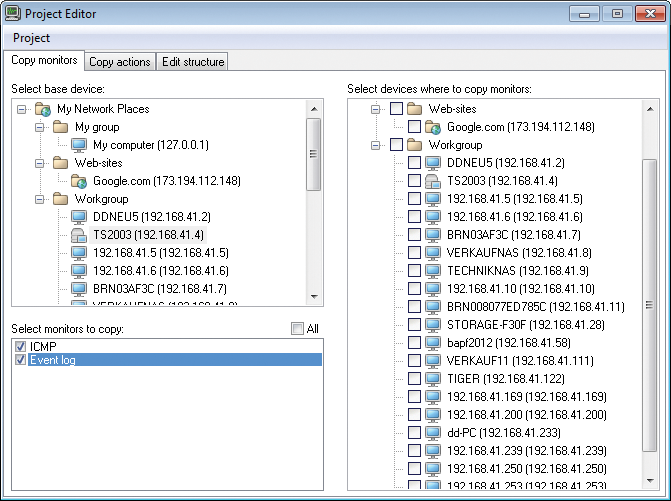
Total Network Monitor comes with Project Editor, a special program for editing XML project files, which you launch via the Tools menu. The Project menu item lets you open an XML project file; you can also copy monitors and actions to other computers (Figure 4).

To proceed, open the desired project file, then select the infrastructure, groups, and server you want to integrate. The monitors then appear in a pane below, and you can copy them to the right-hand side.
Total Network Monitor is a very useful choice for efficiently monitoring a network in a small or medium enterprise. The setup is completed quickly, and if you want to initiate more monitoring, you can add to your setup on the fly.
With a little more effort, you can monitor all of the various system services efficiently and even correct errors. The solution is well worth taking a look at, if only for a quick overview of your own network. If you work fast, you can set up a working network monitoring system in five minutes.
