Zabbix release 2.2
A Closer Look
Network monitoring is increasingly important for small business and the SOHO sector. Identifying problems at an early stage increases availability and thus proactively saves money – regardless of your existing backup, disaster recovery, and high-availability strategies.
Zabbix
The Zabbix [1] monitoring solution has been under development since 2001 and shares a number of similarities with the well-known Nagios. Development of the GPL-licensed software is still largely controlled by Zabbix inventor Alexei Vladishev, who is also the CEO, owner, and product manager of Zabbix SIA, which offers commercial services related to Zabbix.
As with other monitoring tools of the genus, Zabbix optionally uses simple checks that can be accessed externally without installing additional software on the monitored hosts (i.e., standard services like SMTP, SSH, and HTTP). Alternatively, the download page offers several agents for all major operating systems such as Linux, BSD, AIX, Solaris, and Windows.
As a third option, Zabbix can also retrieve the required monitoring information using the SNMP or IPMI network management protocols built into all modern operating systems. The most important difference (compared with Nagios) is that the Zabbix web interface not only visualizes the information it collects but also lets you configure the hosts to be monitored in the web browser.
Like other monitoring solutions, Zabbix also sends email, text, or instant messages in the case of an incident. As the storage back end for the collected information, as well as for the configuration data of the monitored hosts, you can choose from MySQL, PostgreSQL, IBM DB2, Oracle, or SQLite. In terms of handling, Zabbix is characterized especially by its convenient ability to combine hosts, actions, items, and triggers, as well as its convenient management of graphs, screens, and maps. The way hosts are represented in different types of maps is very elegant.
Furthermore, a Zabbix installation can use Zabbix proxies and Zabbix nodes to distribute the installation over several locations; both synchronize regularly with the Zabbix server. Zabbix proxies carry out monitoring on behalf of the Zabbix server, which takes some of the load off the Zabbix server. Zabbix nodes are subordinate servers but offer the same functions as a Zabbix server.
In version 2.2, Zabbix has more than 100 new features compared with version 2.0.9. For example, a value cache now ensures even faster processing of triggers. Further speed improvements result from the fact that the developers have revised the actual data transmission process and the caches for histories and configurations. Additionally, the Zabbix server now processes time-based functions in parallel.
Zabbix is also interesting for potential Nagios converts because the software can now monitor VMware vCenter and vSphere platforms. Zabbix detects virtual machines automatically and includes the utilization and availability of VMs and hypervisors in its monitoring scope. If you are already familiar with Zabbix, you will know that the software no longer has unknown events in version 2.2.
Furthermore, the new application inheritance logic lets you combine multiple templates with the same application. In web monitoring, you can also select template-based scenarios and use regular expressions. When checking the availability of a service in Zabbix 2.2, you can also set the number of repetitions. Developers will be interested in the fact that the Zabbix makers have also revised the Zabbix API.
Installing Zabbix
Zabbix is available from the download page either as the source code or in the form of binary packages for RHEL, Debian, and Ubuntu. Zabbix also is included in the repositories of many distributions, although typically as version 2.0.9. The Zabbix team also offers Zabbix virtual appliances based on openSUSE 12.3 for VMware, VirtualBox, KVM, Microsoft (VHD), and in the Open Virtualization format – again, only in version 2.0.9 when this issue went to press. For some distributions, such as Ubuntu 12.04, Zabbix offers its own repository for the installation of the current 2.2 version.
Installing from the source code works well if the installation requirements are met – that is, if you have the required PHP modules, including gd, mysqli, libxml, and ctype in place. Additionally, an unprivileged zabbix user is necessary for the Zabbix daemon.
If you want the server and agent to run on the same machine – for example, to include the server itself in your monitoring setup – you need a separate user for the agent. To create the databases for a Zabbix server or proxy, the project page has scripts for MySQL, PostgreSQL, Oracle, IBM DB2, and SQLite [2]. Then, you can configure one of the sources. For example, if you are using MySQL, enter:
./configure --enable-server --with-mysql --with-net-snmp
To configure the source for a Linux agent, you would instead enter:
./configure --enable-agent
Compiling with make install should work fine in both cases.
The Zabbix server daemon is launched by the zabbix_server command, and the agent on the system to be monitored is launched by zabbix_agentd. Until the web interface is installed, you need to set up the agent manually in the respective /usr/local/etc/zabbix_agentd.conf configuration file on the host you want to monitor. The file needs to contain at least the Zabbix server's IP address, as well as the port on which the agent listens to requests on the server (ListenPort=10050). The /etc/zabbix/zabbix_agentd.conf configuration file decides whether the agent is launched as a daemon.
Configuration
Further configuration of the server is done in the /usr/local/etc/zabbix_server.conf file; it must contain at least the database name (DBName=zabbix), the administrative database user (DBUser), the admin's password (DBPassword), and the default port for the Zabbix daemon (ListenPort=10051). Additionally, the admin needs to modify the firewall configuration on the server (if enabled) or modify the agent (ports 10050, 10051) so that they can communicate.
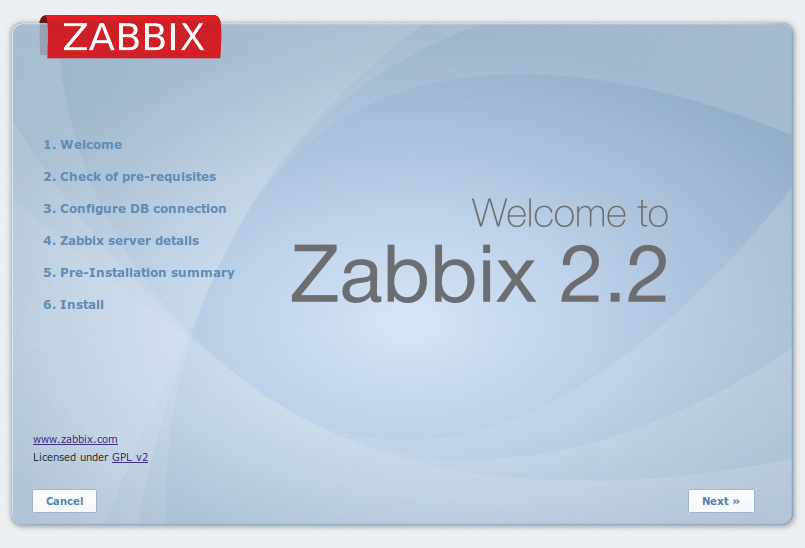
Setting up the web interface is not difficult. Because the front end is written in PHP, the admin just needs to copy the PHP files to the document root of the respective web server, for example: /var/www/html (Fedora, RHEL, CentOS), /var/www (Debian, Ubuntu), or /srv/www/htdocs (SLES, openSUSE). Once the web server is running, you can continue installing the web interface graphically via the URL http://server-IP/zabbix in the installation wizard for the front end (Figure 1).

For the appliances and the precompiled versions, you can leave out the steps I just described, including the installation of the web front end. By default, the admin logs in to the web interface with a username of admin and a password of zabbix. Other accounts are the root/zabbix account for the command line and root/zabbix as well as zabbix/zabbix for the database.
Configuring Hosts
The web interface distributes all the functions over the Monitoring, Inventory, Reports, Configuration, and Administration tabs. The Configuration | Hosts menu is used to monitor a host with Zabbix.
The host list in the appliance also includes the Zabbix server itself, which can also be monitored with Zabbix. For a new host, select all in the Group menu and then press Create Host; this takes you to the dialog where you can configure the host. The host does not need to be a PC. A host in Zabbix-speak is any network device that has an IP address.
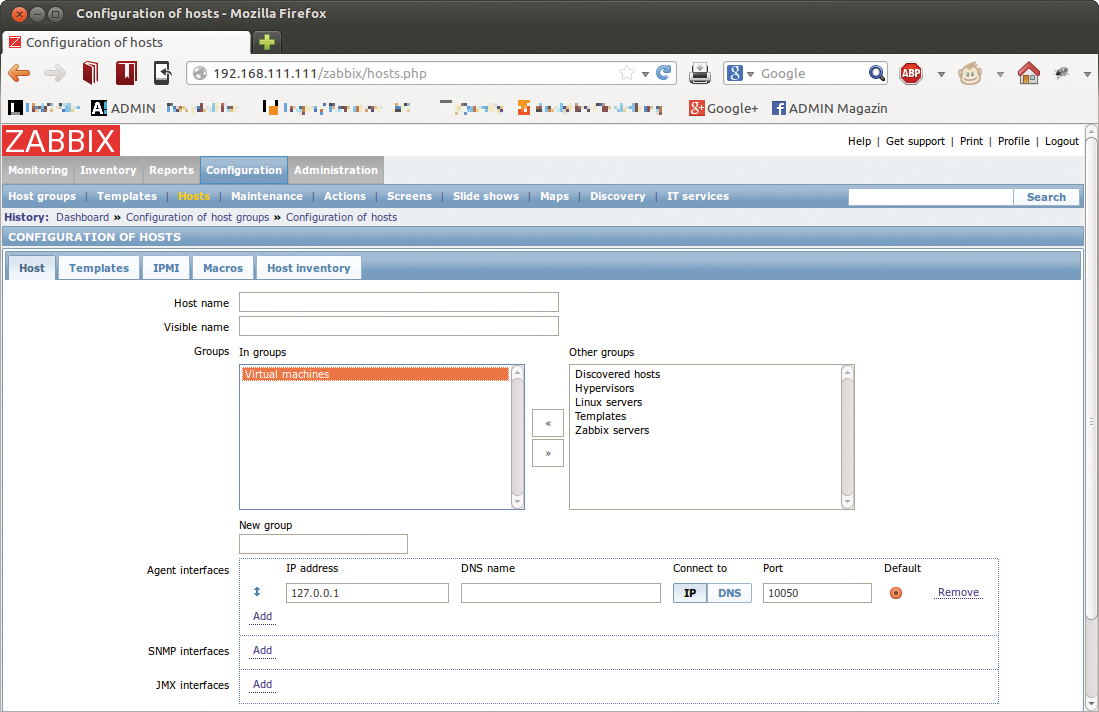
Along with a freely selectable Host name and a slightly more detailed Visible name for the monitored host, where appropriate, you also need to select a suitable host group. The preconfigured groups are merely provided as examples.
Next, provide the obligatory technical parameters, such as the DNS name, the IP address, and the desired port (by default, this is the Zabbix port number 10050) for monitoring (see Figure 2).

Collecting Data
After you've created an initial host for monitoring, Zabbix can now collect data from it. To allow this to happen, go to Configuration | Hosts and, in the Items column of the host list, click on the matching Items(0) link. Then, use Create item at the top right to open the Item dialog to configure the monitor type.
The available monitoring types are found in the Type drop-down box. Besides the default entry, Zabbix agent, the options include various SNMP agents, an IPMI agent, an SSH agent, a database monitor, simple checks, or external checks. In addition to the monitor type, you can press the Select button beside the Key box to select from a number of internal Zabbix keys that more closely specify the details of the monitoring type.
As a fast agentless test, you could, for example, set the Simple checks type and then select the icmpping Zabbix key in the Key field. You can click Select to view a list of all keys for the Simple checks type. To configure this simple type of monitoring using ping, press Save; it now appears in the item list with a status of Enabled, although initially no trigger is configured.
Triggers
You can then move on to configuring the triggers. Again, in the Configuration | Hosts menu, go to the Triggers column and click on the link. To create a new trigger, you then select Create trigger. The dialog initially wants you to enter an intuitive name. Pressing the Add button then lets you formulate the associated Expression, which describes when the trigger assumes the true or false state. After clicking Select, you first select the item from the Items list in a pop-up window. The entry for Function is set by default to Load (most recent) T value=N, which you can use without any changes.
This means that the trigger assumes a true state if the last computed value of the xxxxx:icmpping item is N (null). Clicking on Insert defines the expression and sends you back to the Trigger dialog, in which you can then define the Severity of the trigger using the list box. This can be, for example, Information or Warning.
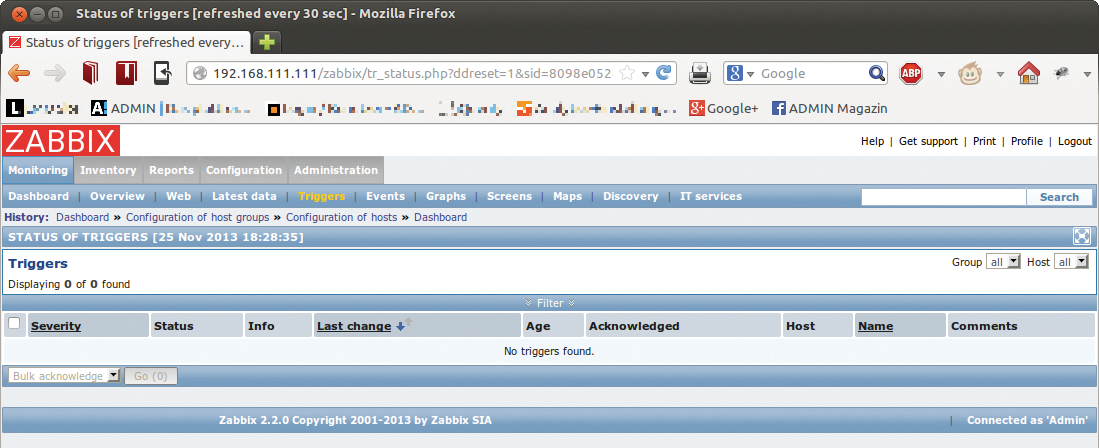
The Expression constructor link lets you define individual triggers and add macros, if needed. Pressing Save takes you back to the trigger list, which lists the newly defined trigger in the Status column with a status of Enabled. You can view trigger status at any time below Monitoring | Triggers. You need to set the right filters to find the trigger in question in the Host or Group fields (Figure 3).

Actions
When a trigger occurs, a monitoring solution like Zabbix needs to trigger an event, such as emailing the on-duty admin. For this to happen, you must first select Administration | Media types to set up an SMTP server. The Type field by default includes the Email, Jabber, and SMS types. If you want to send email when a trigger is tripped, click on Email and add the values for the SMTP server, SMTP helo, and SMTP email, where SMTP email is the sender address that Zabbix uses to dispatch the message.
If you then click on Media in the respective user login dialog, you can then press Add to add a new medium of the Email type and add the desired target email address in the Send to field. The checkboxes are used to set the severity level.
You can set up an action in the Configuration | Actions menu. If you select Triggers from the drop-down box beside Event source and then press Create action, the dialog for configuring an action appears. In the Action tab, you can compose a default message and enter a freely selectable name for the action. It makes sense here to use {TRIGGER.NAME} or {TRIGGER.STATUS} to access the variables.
Next, you can formulate the condition in the Conditions tab and define an operation by clicking on New in the Operations tab. The Operations type drop-down box offers a Send message option, among others. Pressing Add for Send to Users or Add for Send to User groups then lets you define the targets.
Better with Agents
In professional use, you may prefer the agent-based variant or, alternatively, perhaps SNMP- or IPMI-based monitoring over agentless monitoring. The excellent visualization functions below Monitoring | Graphs, Monitoring | Screens, and Monitoring | Maps are also worth looking at. Furthermore, Zabbix offers an Inventory menu with features that other manufacturers would sell as a standalone product.
Conclusions
Admins will particularly like the Zabbix web interface, which allows configuration of the host, items, and triggers, rather than just visualizing the monitoring results. With many add-ons and third-party tools available, including the loadable modules architecture added in version 2.2, Zabbix is at least on par with the Nagios ecosystem.
Zabbix's extensive visualization capabilities and the availability of templates as the basis for "applications" also speak in favor of this powerful tool. Despite the huge feature set, you will quickly find your way around the well-structured web interface, which remains clear despite the wealth of detail.
