Monitoring with collectd 4.3
The Collector
Collectd [1] is a familiar site on Linux and Unix systems. The collectd developers bill the tool as "the system statistics collection daemon," which means it is like many other system monitoring tools that inhabit the network. Still, the simplicity, versatility, and portability of collectd make it the tool of choice for many environments.
For many users, the really impressive feature of collectd is its design and pervasive modularity. Everything that is available in terms of monitoring functionality comes exclusively from plugins that the collectd core just loads. Collectd is written in C and contains practically no code that would be specific to any single operating system, so it can operate on almost any Unix-style system. Additionally, it is extremely frugal: Because this tool requires very few resources, it also runs on minimal hardware like the good old Linksys WRT54G or a Raspberry Pi.
The goal of collectd is simply to gather statistics about the system and store the information. Florian Forster published the first versions of collectd [1] in 2005, and his work has been continued and extended by an enthusiastic FOSS community ever since.
Installation
Although versions of collectd run in many different environments, in everyday life, admins who rely on collectd for their monitoring needs are more likely to deploy classic server hardware on Linux. A commercial box is perfectly adequate and, no matter which Linux distribution it runs, collectd is ready in almost no time. Debian-based distributions include collectd as a package, and if you feel more at home on CentOS- or RHEL-based systems, you will find precompiled packages of the current version of collectd on the web.
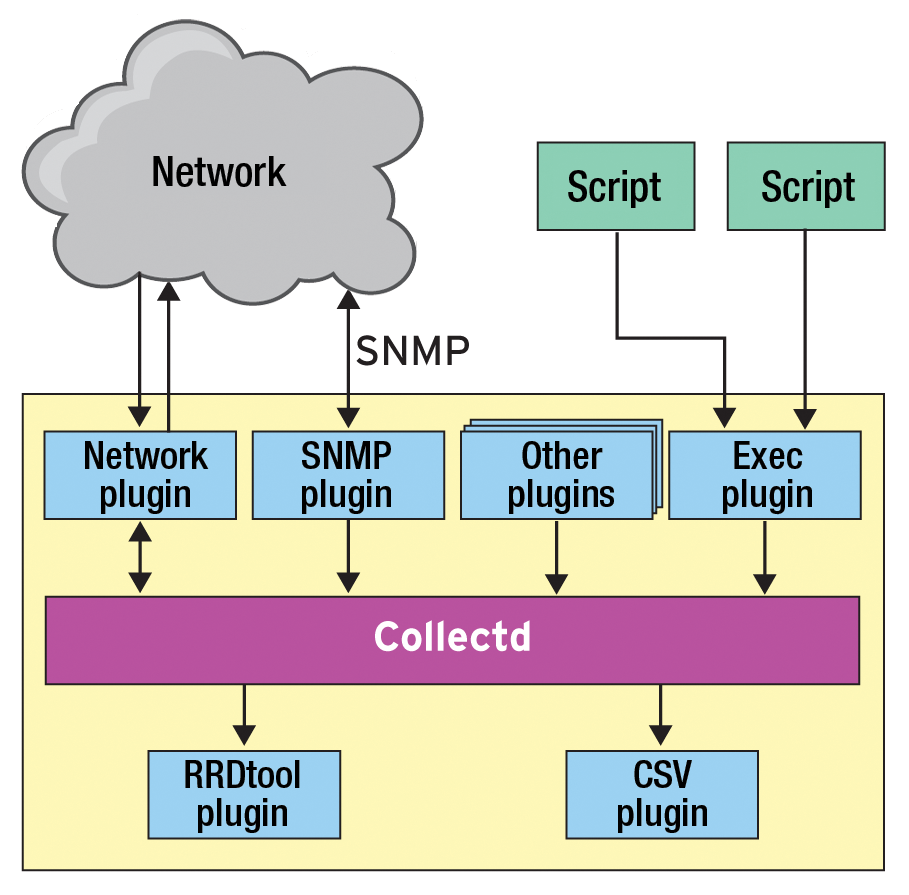
Collectd, which is very easy to install, works on a simple client-server principle (Figure 1). A central server runs the most important collectd, but you also start an instance of the service on each host to be monitored.

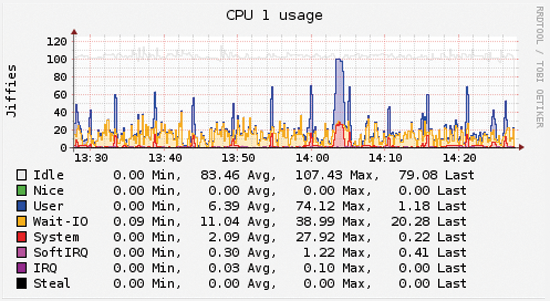
An exchange of data takes place between the many collectd instances and the master server. Read plugins collect the monitoring data on the monitored systems, and a write plugin then sends data to the collectd master instance via a separate protocol. The master evaluates and processes the data, presenting the results in a web interface. If you are now thinking of some kind of Nagios [2] or Icinga [3] look-alike, think again – the web GUI mainly shows you RRD graphs from which you can check the status of a service over a period of time (Figure 2).

Several, mainly historical, objectives influenced the design. Collectd was not originally intended for monitoring but as a tool for admins who wanted to discover the required degree of scaling. Collectd was designed to keep records that revealed what load was generated by what systems and in what period of time so that the admin could react in good time and deploy more metal in the network environment.
The monitoring function did not make its way into collectd until 4.3 as the Notification feature, and – of course – it relies on plugins. Version 4.3 was also the first version to use thresholds. Users regard version 4.3 as the first complete monitoring solution on a collectd basis.
Simple Yet Sophisticated Configuration
Collectd comes with a single configuration file. Putting all the configuration in one file is advantageous because it avoids a jungle of files, such as the situation you might be familiar with in Nagios. On the other hand, this principle means your collectd.conf becomes fairly lengthy within a relatively short period of time and mutates into something only you will understand.
Comments are allowed and recommended. In collectd.conf, you will initially find the general settings that affect collectd on the host. For each plugin, you'll find a LoadPlugin line; loaded modules can be configured lower down in the file below the Plugin directive – the syntax is reminiscent of the Apache configuration syntax. The config process makes one thing clear: Each host needs its own version of collectd.conf that defines for which services Notification events are executed.
What happens in the case of Notification events is largely left to the discretion of the admin: The Network plugin, which is responsible for client-server communication, can, for example, refer Notification events to the master server, which then sends an email alert based on a definable process. This method makes it possible to convert what was intended to be a tool for performance measurement into a genuine monitoring tool.
Plugins, Plugins, Plugins
Collectd mastered the test scenario very well. Of course, plugins are available for querying central system values: The CPU plugin checks the CPU load of a system; the memory plugin can check a host in terms of its available memory, and the DF plugin makes sure the disks do not fill up. A smart plugin on the web also lets you run a health check on your disks.
For virtually any popular service that defines the IT admin's daily grind, you are likely to find a check plugin – whether it's Bind, MySQL, or Apache. If you virtualize on a host and use libvirt for doing so, you can discover in detail how your VMs are feeling by using the matching plugins. A similar plugin is also available for Xen, and the obligatory ping plugin is something you would not want to be without.
Blessing or Curse?
The sheer volume of plugins available for collectd can be a blessing and a curse. The plugins allow for massive flexibility on the one hand, but things can become confusing quickly. For each plugin in the example, the admin has to check the configuration parameters that can, or need to, be used in collectd.conf.
Plugins are basically scripts; in fact, they are mostly shell scripts. The parameters differ from plugin to plugin, and a few of the featured plugins are not even included in the official collectd scope and must be installed separately.
This modular design makes for a relatively high degree of complexity. Although you can definitely set up a comprehensive and fully functional monitoring environment, you can also expect a fair bit of work when you start to tackle the somewhat complex configuration work.
Graphical tools that produce a final configuration based on the configured parameters do not currently exist. Admins looking for an easy workaround to all that editing in collectd.conf are, unfortunately, out of luck.
Conclusions
Collectd is a complex tool that provides full-fledged monitoring and generates RRD graphs for the acquired test values. This feature greatly facilitates an admin's daily work, if you actually make it to the point where collectd starts making things easier for you.
Although installing collectd is very easy, it may take some time to build a complete collectd.conf for every single host on your network. You will spend even more time if the computers differ in a major, or even minor, way.
In terms of complexity, collectd is on par with any Nagios or Icinga installation. Thus, anyone using collectd can expect good-quality monitoring at the price of a very complex installation.
