Visualizing time series data
Painting by Numbers
Graphite [1] is hierarchically structured, real-time graphing system (Figure 1). A client collects data from the source, and a Graphite daemon (Carbon [2]) on TCP port 2003 receives the data and stores it in a round-robin database named Whisper.

A web application then grabs the data from this database and creates charts. The client can be programmed by the user or it can come as a prepared daemon (e.g., collectd [3]). If you like to measure your own applications, you can send performance data to a client like statsd [4].
Installation
The easiest way to install Graphite is from the package repository of your distribution. Graphite is available in some of the latest distributions, like Fedora 20 or Ubuntu 14.04 LTS. You can also find ready-made images for a virtualization solution like Docker. A simple docker graphite search shows a number of Graphite images.
Of course, you can also install Graphite from the Git sources [5]. In this case, however, you must consider that not all versions of the needed libraries will work well together, whereas the package maintainers have taken over the task of sorting this out for you.
All packages come with prepared config files. They contain reasonable defaults, so you won't have much to edit. Fedora has the necessary init files, but they are not activated to start automatically on a certain run level.
Example Client
The Git sources contain an example client written in Python that is missing in the Ubuntu package. However, this is not the end of world, because it is fairly easy to write a client in a language of your choice: I used Perl for an example in this article (Listing 1). The only thing the client has to do is send a text string in the format
Listing 1: Perl Example Client
01 #!/usr/bin/perl
02
03 use strict;
04 use warnings;
05 use IO::Socket;
06 use Sys::CpuLoad;
07
08 my $remote_host = '192.168.56.102';
09 my $remote_port = 2003;
10
11 # create Socket
12 my $socket = IO::Socket::INET -> new(PeerAddr => $remote_host,
13     PeerPort => $remote_port,
14     Proto => "tcp",
15     Type => SOCK_STREAM)
16     or die "Couldn't connect to $remote_host:$remote_port: $@ \n";
17
18
19 while() {
20  my @lavg = Sys::CpuLoad::load();
21  my $ts=time();
22  print $socket "system.loadavg_1min $lavg[0] $ts\n";
23  print $socket "system.loadavg_5min $lavg[1] $ts\n";
24  print $socket "system.loadavg_15min $lavg[2] $ts\n";
25  sleep(60);
26 }
27
28 close($socket);
<metric_name> <metric_value> <metric_timestamp>
to port 2003 on the Graphite server. The time stamp is an integer value in Unix time (i.e., POSIX time or Epoch time), which is the number of seconds since 00:00:00 Thursday January 1, 1970, Coordinated Universal Time (UTC).
The example client in Listing 1 sends the load average values of the last 1, 5, and 15 minutes (lines 22-24), which you can find in the web GUI under the system node. Dots in the name create folders in the hierarchy; to create a graph, you then just click on one of the values in the web app.
Collectd
An alternative to a self-written client is collectd. This daemon, which is available in most distros from their package management system, can delivery a variety of performance data to Graphite.
The collectd configuration file, /etc/collectd/collectd.conf, will need some changes. You have to remove the comment characters before the write_graphite plugin entry, adapt the Host line, and set the protocol to tcp.
The rrdtool plugin isn't necessary anymore and should be commented out. Furthermore, you should set AutoLoadPlugin to true. Next, activate the desired plugins listed in the config file; then, restart the daemon with
/etc/init.d/ collectd restart
to send the values of the activated collectd plugins to Graphite. If the daemon is receiving values, you should see a line like
14/07/2014 12:38.21 :: MetricLineReceiver connection with \
  192.168.56.1:52981 established
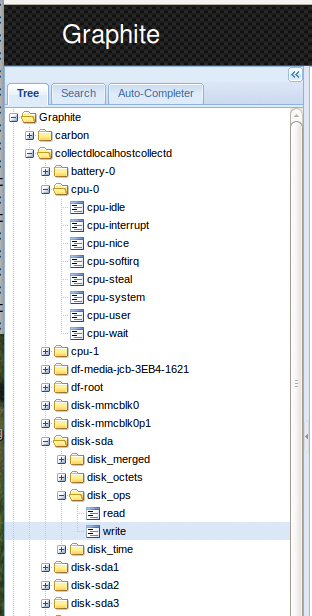
in the logfile /var/log/carbon/listener.log. If not, an error message may point you to a malformed line. If you have a problem with the connection, you can look in the syslog of the collectd host. If all went well, a collectd entry appears in the tree view of the Graphite host with all the values for the activated collectd plugins (Figure 2):

statsd
If you are not interested in operating system metrics, but in the performance of your own applications, statsd is your friend. This daemon can count events, measure their duration, and buffer and forward the resulting values on a regular basis to a back end like Graphite.
Libraries for a number of programming languages can increment counters, start timers, and send the results to statsd. To start statsd from /opt/statsd via the Node.js JavaScript server, you can enter the command:
/usr/bin/node ./stats.js ./localConfig.js
Before you do this, however, you need to generate or edit the configuration file localConfig.js, which should contain at least the following lines (you will need to adjust the IP address):
{
   graphitePort: 2003,
   graphiteHost: "192.168.56.102",
   port: 8125
}
In this example, I use the Perl package Net::Statsd to instrument a benchmark (Listing 2).
Listing 2: Instrumentation with Perl
01 #!/usr/bin/perl
02
03 use Time::HiRes qw(gettimeofday tv_interval);
04 use Net::Statsd;
05
06 $Net::Statsd::HOST = 'localhost';    # Default
07 $Net::Statsd::PORT = 8125;           # Default
08
09 my $t0 = [gettimeofday];
10
11 my($one, $two, $three) = map { $_ x 4096 } 'a'..'c';
12
13 $s .= $one;
14 $s .= $two;
15 $s .= $three;
16
17 my $temp;
18 for (my $i=0; $i<12288; $i++) {
19    $temp=substr($s,length($s)-1,1);
20    $s=$temp.$s;
21    $s = substr($s,0,12288);
22 }
23
24 $elapsed = tv_interval ( $t0, [gettimeofday]);
25 $elapsed = int($elapsed * 1000 * 1000);
26
27 Net::Statsd::timing('charbench', $elapsed);
This trivial script first creates a 4KB string of each of the letters a, b, and c; then, it puts the last character of the string into the first position over and over until the string reaches its initial state.
The script also measures the duration of each pass and sends the value via UDP to statsd. Statsd subsequently forwards the value to Graphite. By starting the script as a cron job once a minute, you can create a chart as in Figure 3.

Web GUI
The web GUI contains the tree view of all configured metrics in the left frame and shows a resulting graph in the right frame. If multiple metrics have a similar range of values, you can superimpose graphs.
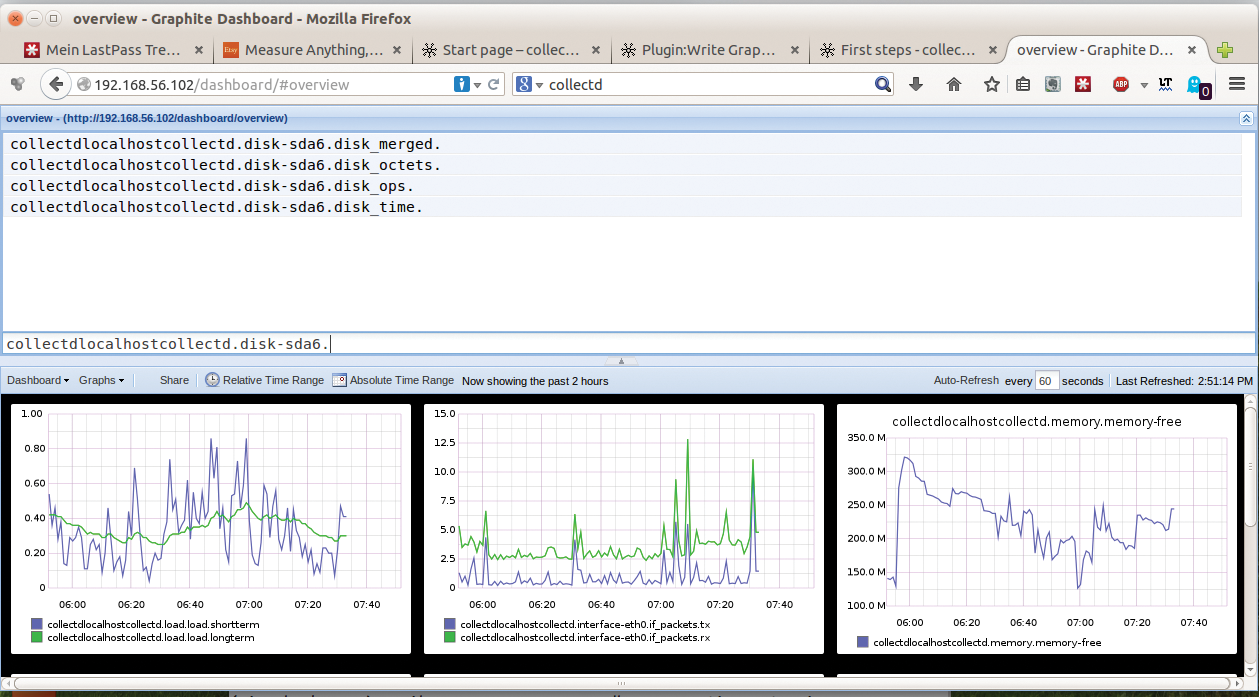
In all other cases, use the Dashboard button, which leads to an area in which you can arrange a number of graphs in the same window by choosing metrics either from the tree view at the left or from a menu in a top frame (Figure 4).

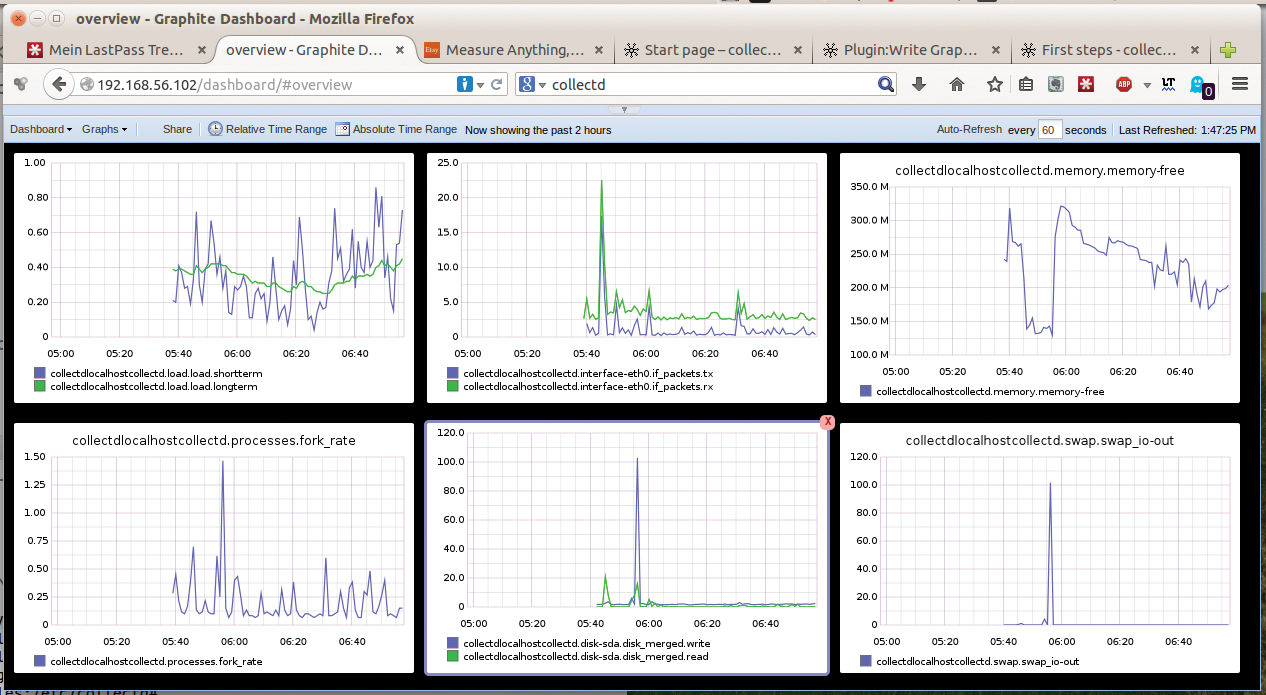
Every metric you choose gets its own graph. If you drag one chart on top of another, the graphs are combined (Figure 5).

You can save dashboards and reload them later, and a search function lets you search for saved dashboards. Chart sizes, periods of time displayed, and automatic refresh intervals can all be customized.
Conclusion
Graphite is released under the Apache 2.0 license. It was written by Chris Davis and is maintained and actively developed by Orbitz.com to "… visualize a variety of operations-critical data including application metrics, database metrics, sales, etc.," and "… handle approximately 160,000 distinct metrics per minute running on two niagra-2 Sun servers on a very fast SAN" [6]. Graphite is thus best used in environments that need to monitor thousands of regularly updated metrics in real time.
