Creating Active Directory reports using free tools
Free and Active
Several commercial tools provide the ability to read reports from Active Directory, but these tools are not exactly cheap. If you're looking for a less expensive approach, free tools are available for the task, and many deliver usable results. You can use free tools to evaluate Active Directory (AD) permissions, users, user data, and more.
A big advantage of these free tools is you do not need to run them on the domain controller – some you don't even need to install. All you need is a computer in the Active Directory forest. I tested these utilities with Windows Server 2012 R2 and Windows 8.1; they also run well on Windows 7 and Server 2012.
Reading Rights with AD ACL Scanner
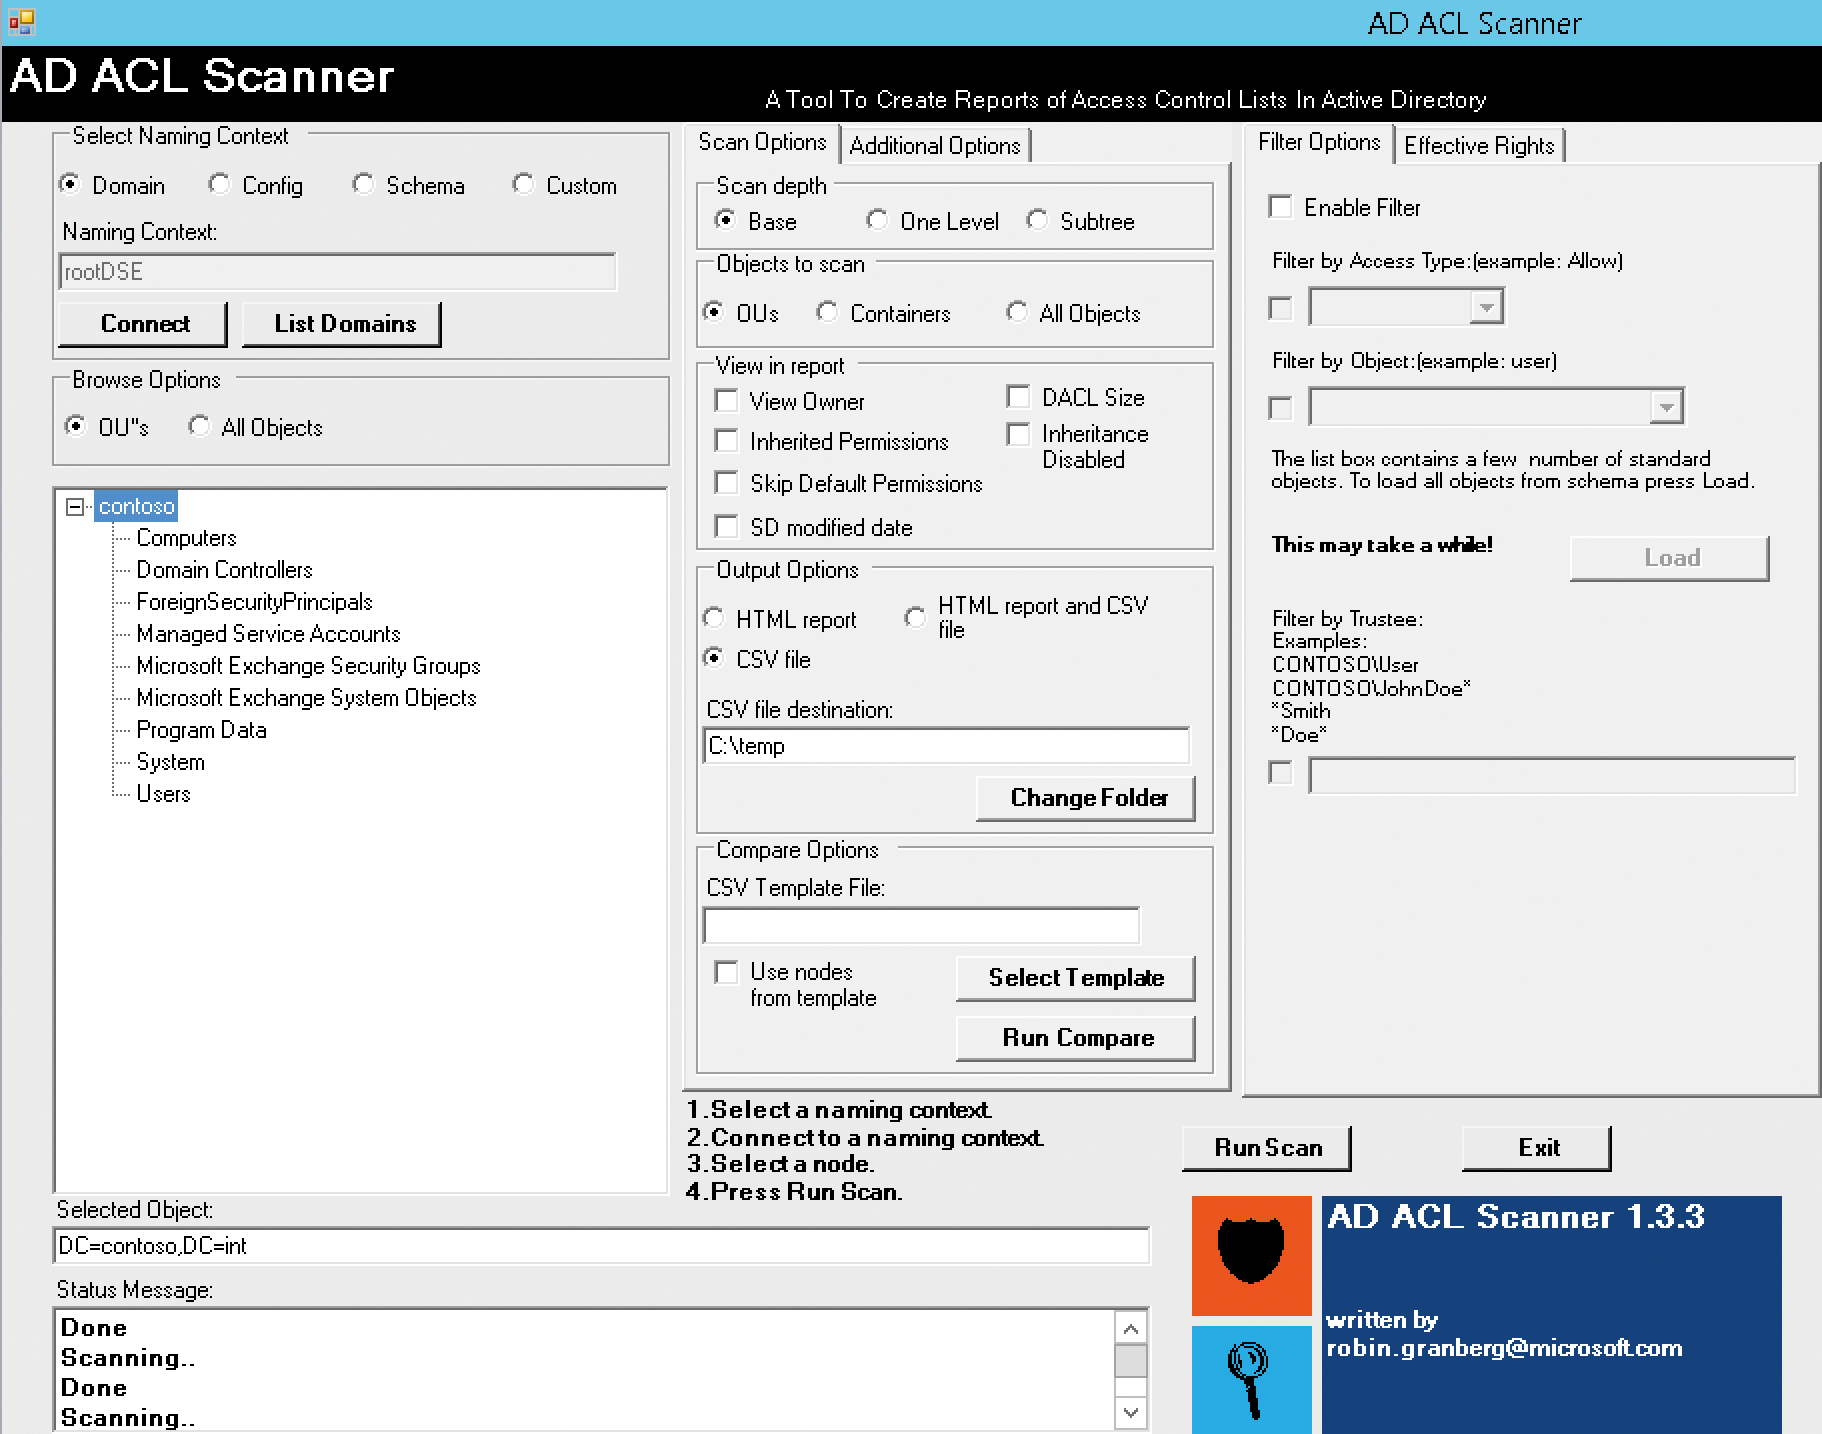
In companies where multiple administrators manage Active Directory and a complex authorization model is in use, the authorizations in AD should be read and documented regularly. This step is especially necessary if audits are carried out in your company. However, it may also be useful to check which administrators or user accounts have rights in the different organizational units. The PowerShell script AD ACL Scanner [1] is useful here. It launches a graphical interface without the need to install. You just call the script file and display the rights in the associated interface.
In addition to administrative rights, the tool also can display whether users with delegated privileges – for example, for resetting passwords – have been given authorizations that are too liberal. This information tells you whether user accounts have administrative rights in organizational units, for which they are not required. Also, the tool helps avoid redundancies. You can see whether a user account has the right to manage other accounts in several ways, such as through direct allocation and through membership in a group (Figure 1).

To use the tool, you need to allow script execution in PowerShell on the appropriate computer. The Set-ExecutionPolicy Unrestricted cmdlet lets you execute any script in PowerShell. However, you should only temporarily override this setting and restore the default after running the script. You can change the execution policy with the Set-ExecutionPolicy cmdlet, and you can show the setting with get-ExecutionPolicy. The following settings are available:
-
Restricted: Default on Windows Server 2012 and Windows 8, which allows no scripts. -
AllSigned: Only signed scripts are allowed. -
RemoteSigned: Only scripts signed through a certification authority are allowed. This setting is configured in Windows Server 2012 R2 and Windows 8.1. -
Unrestricted: Any script will work with this setting.
If the computer on which you start AD ACL Scanner has an Internet connection, set the option to RemoteSigned. This setting is preset in Windows Server 2012 R2 and Windows 8.1; in previous versions, you need to first adjust the settings, then enter the .\adaclscan1.3.3.ps1 command or the name of the version you have downloaded in PowerShell. You must be in the directory that contains the tool to do this.
You can also use filters. When you press Connect, the tool connects with the authorizations of the logged-on user and displays some initial data. In the bottom box, click on the organizational unit (OU) or domain you want to scan. Run Scan tells the tool to read the rights extensively. Then, AD ACL Scanner displays the report. You can print this or export it as an HTML report.
In the center pane on the Scan Options tab under Output Options, choose the setting CSV file and then set the output directory where AD ACL Scanner will export the CSV files as reports. Another usage scenario is validating rights in each organizational unit. After connecting to the domain, click on the OU you want to scan.
In more complex environments, the report can quickly become cluttered. For this reason, AD ACL Scanner provides the ability to filter the output in the right-hand pane. This way, you can search directly for permissions (Allow) or denied permissions (Deny), for example. Here, you also can control the objects the tool scans. In the middle pane, you can specify the Scan depth – that is, how deep the script should check for rights. In the Additional Options tab in the center pane, you can convert the CSV files of a report to HTML on request.
Creating Reports with AD Info
Another freeware tool in this category is AD Info [2]. The tool can read reports, but it must be installed. Additionally, .NET Framework 3.5 SP1 must be in place to use the tool. After launching AD Info, you will see the tabs and the areas for which you can create reports at the top. In the Computers tab, you can view, for example, computers with certain conditions. The results are shown at the bottom. The context menu of the individual result entries lets you copy the contents of the fields to the clipboard. In the File menu, you can save the results as CSV or HTML files.
AD Info is also available as a commercial variant, which lets you create your own queries and reports, for example. The queries can be scripted and automated in the commercial variant. A group policy template is also available for the commercial version, which you can use to automate settings.
Also in the Computers tab, you can filter the display – if necessary – by SID, GUID, account creation date, operating system, activity, and more. After double-clicking a report, you can select which data the tool should scan and display. In addition to computers, you can view other objects through the various tabs in AD Info.
In the Contacts tab, you can display, for example, any contacts you have created in Active Directory, as well as any contacts in Exchange. Containers & OUs takes you to information about the organizational units. You also search for associated group policies here, if needed. In the report, you can display the linked GPOs. This makes the tool useful for troubleshooting Group Policy or for documenting how you have linked the GPOs with domains and OUs in the enterprise.
In the Groups tab, you can customize reports for security groups in Active Directory. Here, too, you can display Exchange groups and distribution lists and read the Group Policy Objects in the domain. These can be filtered according to different criteria, and you can thus verify which policies have been created for computer and user configuration. In Tools | Domain Settings, you can tell the tool from which domain to read data. You can determine the user account that AD Info will use to connect to the domain at this point, and you can also specify the domain controller you want the software to connect with. Tools | Options lets you customize other settings. If you are using the commercial version, you can create your own reports via the Query menu.
Using AD Inspector for Analyses
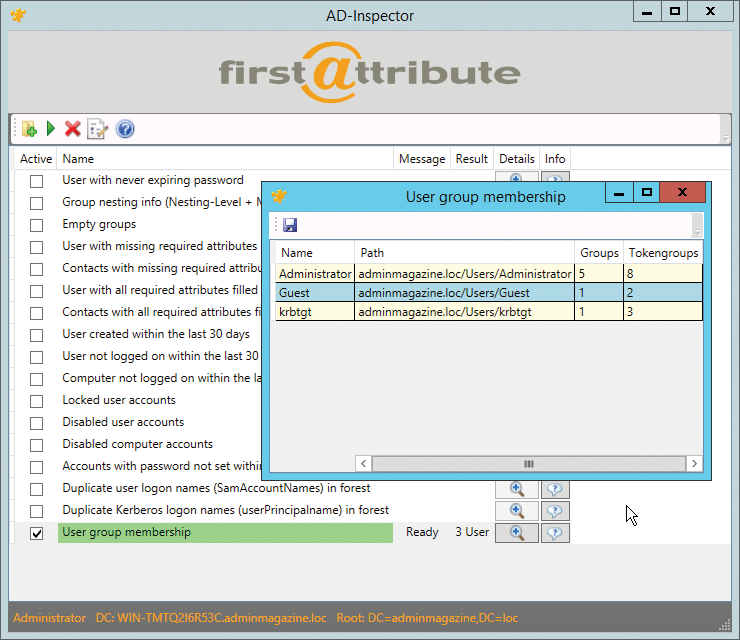
Another interesting tool for analyzing Active Directory is AD Inspector [3]. AD Inspector does not need to be installed; you can launch the tool directly. In the first step, press the folder icon at the top left to select which container you want to analyze in AD. You can examine the entire domain or only individual organizational units. At the bottom of the window, AD Inspector shows the usernames and domain controller that AD Inspector will use for the analysis.
To perform an analysis of group memberships, check User group membership and then click the green triangle in the toolbar. AD Inspector then performs the analysis and displays the row in green. The Result column shows the number of objects the tool has found. To get more information and a detailed report, click the magnifying glass in the Details column; here, you'll also see the users. Pressing the floppy disk icon saves the report to a CSV file (Figure 2).

You can create other analyses in the same way. The Edit configuration icon in the toolbar lets you define limits within which the tool can search for information. You can specify which objects AD Inspector collects, as well as the time periods in which objects were created, and search for users without logins or for unchanged passwords. If you want to create a report that shows users that have not changed their passwords in the last 90 days, set the option Password not changed for (days) to 90. In the options, you can also remove attributes from the reports. To do this, highlight the corresponding line and press the delete key on the keyboard.
AD Inspector launches under the user account with which you are logged on. You can launch the tool with a different user name using standard features. To do so, use the command line and the runas.exe tool. To launch AD Inspector with the username joost in the domain contoso.int, enter the following command,
runas /user:joost@contoso.int \
  "c:\temp\firstware-ad-inspector\firstware-ad-inspector.exe"
and use the path to which you copied the AD Inspector executable. To start the command, you must also enter the password for the specified user. The tool then launches with the desired user account.
Creating AD Queries with Lumax
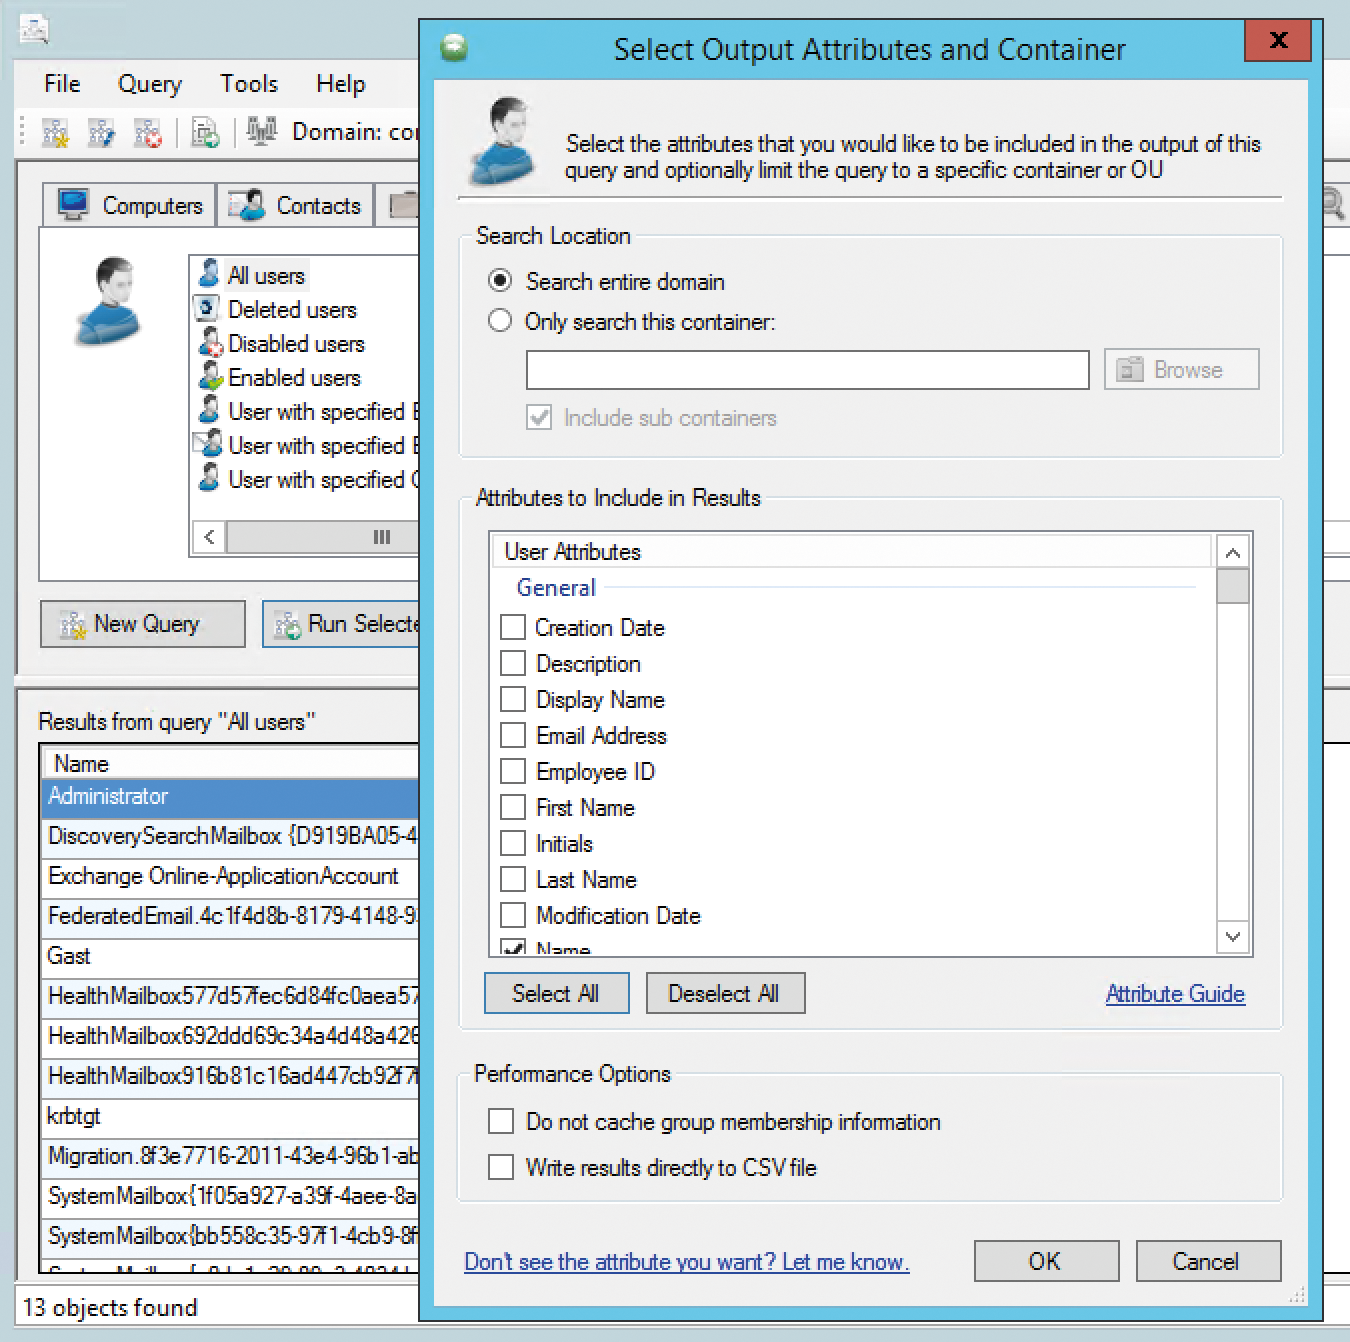
Lumax [4] is another tool for analyzing Active Directory and creating reports (Figure 3). You can use the tool, for example, to view all disabled and locked user accounts in the domain. Lumax also outputs user accounts that are no longer used. It does not need to be installed; as soon as you start the tool, you are connected with AD. Again, Lumax does not need to run on a server or domain controller.

Pressing the Windows flag in the toolbar lets you configure the connection to AD. You can create multiple connections with the New button. For each one, you can define the domain controller, a user, port, and more via the Advanced tab. For security reasons, you should not use the LDAP port 389 for connections; instead, select SSL connect when configuring the Server tab. The connection is then encrypted on port 636. You can identify secure SSL connections in Lumax by the lock symbol and the blue checkmark at the bottom right. After entering all the data, press Fetch and then Save the connection. Then, click Explore, and Lumax will connect to the domain controller and display information about the domain.
In this way, you can store connections to multiple domains, AD forests, or domain controllers. Once you have connected to a DC, Lumax shows the tree structure with the organizational units on the left. The option of filtering the view and color highlighting entries is also interesting. For example, you can display specific objects in red in the tree structure. To do this, click on the OU in which you want to display objects. Using the toolbar at the top, you can now add formatting. If you also want the tool to display objects in child organizational units, click the Show Objects in all Subcontainers button. The symbol is available from the toolbar.
To export the currently displayed report, click on the floppy icon, then save the report as a text file or as an Excel file. In addition to color highlighting via the Highlight Accounts toolbar button, you can show or hide objects by right-clicking the header column of the right pane. Lumax shows its feature richness when it comes to security queries. For example, you can display security-related objects in the selected OU. To do this, click on the desired OU and then select the icon on the far right in the toolbar. The following filter options are available:
- disabled accounts
- locked accounts
- user accounts that are no longer used
- newly created user accounts
- changed user accounts
- user accounts without a password
- user accounts with expired passwords
Again, you can save this view as a report.
Using Group Policy Log View
In addition to purely informative reports, often an analysis of group policy is necessary as well. A few useful tools are available for doing this, and one of the most interesting is the free Microsoft Group Policy Log View tool [5]. The software analyzes the event viewer and logfile on machines and displays the results clearly. Additionally, it can perform real-time analysis of group policy. The tool then summarizes the messages on group policy in TXT, HTML, or XML files.
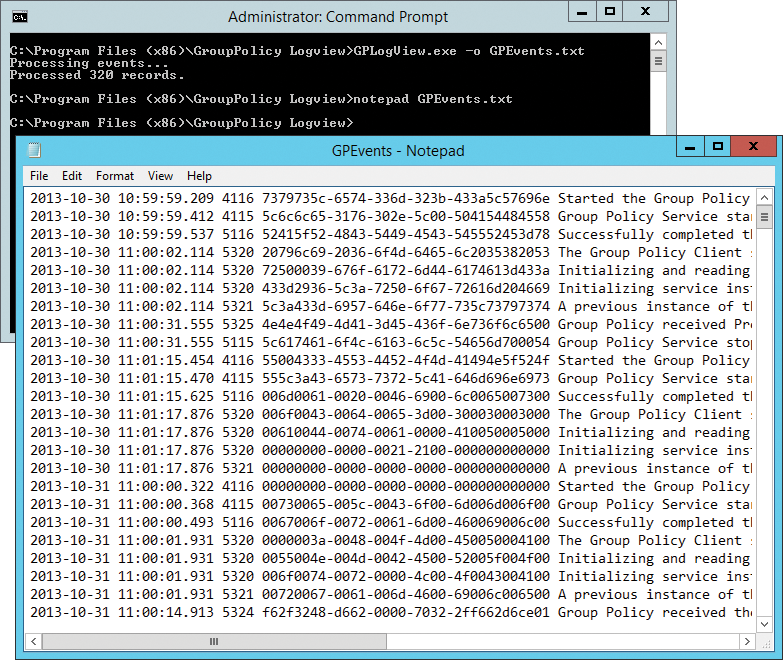
After installation, you will find Group Policy (GPO) Log View in the Programs directory, or Programs (x86) directory on 64-bit machines, below the GroupPolicy Logview subdirectory. To use the tool, pop up a command line with administrator rights, change to the GroupPolicy LogView directory, and, for example, type
gplogview.exe -o GPEvents.txt
to write all events related to group policy to a text file (Figure 4).

If you save the file with the report on a network share, you can run the command via logon scripts. All computers on the network then store their logfiles on the share. As a result, you can collate and analyze the reports. If you collect the logs of several computers on a share, you can use the name of the corresponding computer as the name of the logfile, like this:
gplogview.exe -o \\dell\x\%computername%-GPEvents.txt
The output of an HTML report – use the -h option – is even clearer than a text file. You can refer to the color highlighting to find any issues in the implementation of group policy on your network. Again, you can save the logfiles on shares and use the hostnames:
gplogview.exe -h -o \\dell\x\%computername%-GPEvents.html
This step not only gives you reports but also identifies errors in the application of group policy. Certain events in the reports can be filtered by using the -a option and the activity ID of the entry. You can see this in the logfile after the date. The format is similar to: a9034339-85ce-4ab6-9444-b14c33a93e89. If you want to collect the records with the active ID shown above in a text file, use:
gplogview.exe -a a9034339-85ce-4ab6-9444-b14c33a93e89 \
  -o \\dell\x\%computername%-GPEvents.txt
You can also hide irrelevant data in the results files using the -n option:
gplogview.exe -n -o \\dell\x\%computername%-GPEvents.txt
GPO Log View can also analyze the application of group policy in real time. To do this, pop up a command line with administrator privileges and run the tool in monitor mode:
gplogview.exe -m
In a further window, run gpupdate. In the window with GPO Log View, you will then see messages in real time. For more help, type the gpresult > gp.txt command.
Conclusions
Many tools are available for analyzing Active Directory and creating reports. Each tool offers advantages for its intended use. If you regularly perform queries against AD, you should look at all the tools. Because all programs can be run from workstations or virtual computers and do not need to be installed, they provide an option for a quick overview of Active Directory and the objects that it stores.
