Evaluating logfiles with Microsoft Log Parser Studio
Clear View
Windows systems record status messages in the event log, and some application servers, such as Internet Information Server (IIS) or the Exchange Server, also log event data to text files. You can use the free Microsoft Log Parser Studio tool to monitor and analyze these event logs on Microsoft systems.
Log Parser Studio [1], which is available as a free download on the Microsoft TechNet website, is a graphical front end for the Log Parser command-line tool. Together, these two programs form a useful toolbox for querying large amounts of structured data. The typical intended purpose is analyzing the logs from systems such as the IIS, Microsoft Exchange ActiveSync, Exchange Web Services (EWS), or Outlook Web Access (OWA).
Installation under .NET
.NET Framework 4.x and Log Parser 2.2 [2] form the basis for Log Parser Studio. The latter is a universal tool of just a few megabytes suitable for analyzing both text (i.e., logs, XML, or CSV files) and sources (i.e., Windows's own event logs). Microsoft has had this tool in its program for a long time; thus, it officially supports only Windows 2000, Windows XP, and Windows Server 2003 according to the website. However, the tool also works perfectly with current operating systems from Redmond. Installation is quick: Run the MSI package and accept the license terms, then choose the Complete installation type and start the setup process, which completes in just a few seconds.
Log Parser Studio as a graphical front end for the parser does not need to be installed; instead, just unpack it. To do so, download the ZIP archive, extract the contents to, for example, C:\Program files (x 86)\Log parser Studio 2, and start the application by double-clicking LPS.exe. Studio will automatically find the Log Parser installation, so it can be used right away.
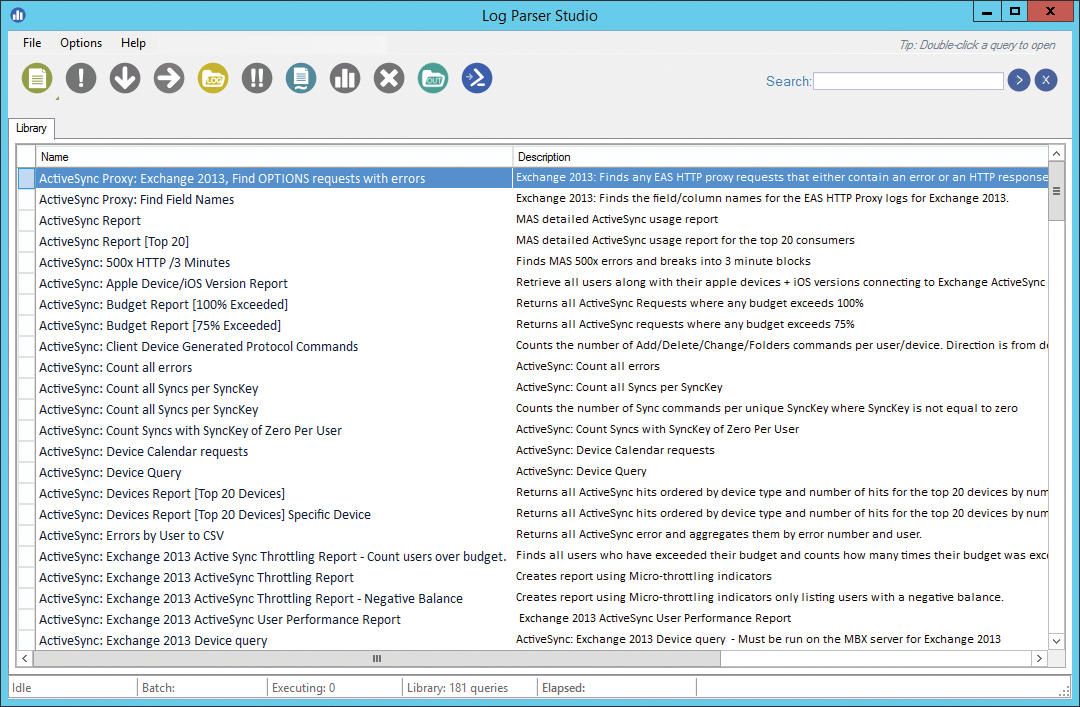
Out the box, Log Parser Studio provides a library of more than 180 queries for different use cases (Figure 1). By default, these are stored in the program directory in the LPSV2Library.XML file. Additional user-defined queries are also saved in this file. If multiple users work independently with Log Parser Studio and are not supposed to overwrite each other's work, you are advised to change the database location from the outset. Go to the Options | Preferences menu and activate the Store library in AppData folder for UAC compatibility option in the following dialog. Then, the database for each user will be filed under %userprofile%\AppData\Roaming\ExLPT\Log parser Studio.

Unfortunately, Log Parser Studio does not indicate that the application needs to be restarted. When started the next time, Studio displays an error message indicating that the library cannot be found in this path. Ignore this message and cancel the search for a library. Log Parser Studio will then automatically create an empty LPSV2Library.XML in the user profile. With the Help | Recover library command, you can restore the queries of the delivery state.
Log Parser Studio 1 Update
If you are already using the first version of Log Parser Studio and have modified or created new queries in it, you can continue to use those queries in version 2. To begin, select the queries in the old version that you want to migrate, and select File | Export | Library as .XML in the menu. Then, save the XML file in the Log Parser Studio 2 program directory. In my tests, I was able to import customized queries into the new version immediately. To avoid problems, you should update the queries to the format of the current Log Parser Studio version before importing them.
To do this, open the new Log Parser Studio program directory. Drag and drop the XML file with the exported queries onto the ConvertLib.exe application. The tool writes the converted queries into a new file and adds the _converted string to their names. Import this file into Log Parser Studio using the File | Import | .XML to library command. The Query Import window will appear, in which you can select one or more queries to import. Caution is required here: The Replace Now button not only overwrites existing queries of same name (as you might expect) but also completely replaces the existing library. All existing queries are discarded here. Choosing the Merge Now button instead will add selected queries from the library and keep all existing queries.
Evaluating Event Logs
Queries are categorized by type on the basis of name. Thus, all queries that start with EVENTS evaluate the event log. Double-clicking the EVENTS: count errors and warnings every 24 hours entry opens the appropriate query in a separate tab. At the bottom, you will see the query's code. The top of the window is initially empty. If you click below the menubar on the second button from the left (the exclamation mark in a red circle), the query is run against the local system. A table showing the errors and warnings in the Application event log for each day appears in the output window.
The queries are based on Transact-SQL and can, with appropriate knowledge, be adapted to your own needs [3]. To modify an existing query, click the lock icon in the toolbar above the code editor. The code is then released for editing. With altered FROM and WHERE clauses, you can, for example, evaluate the Security event log for failed logins. To do so, search for event ID 529 on systems up to Windows Server 2003. On newer systems after Windows Server 2008, event ID 4625 delivers the desired result:
SELECT QUANTIZE(TimeGenerated, 86400) \
  AS Day, COUNT(*) AS [Logons]
FROM SECURITY
WHERE EventID = 4625
GROUP BY Day
ORDER BY Day ASC
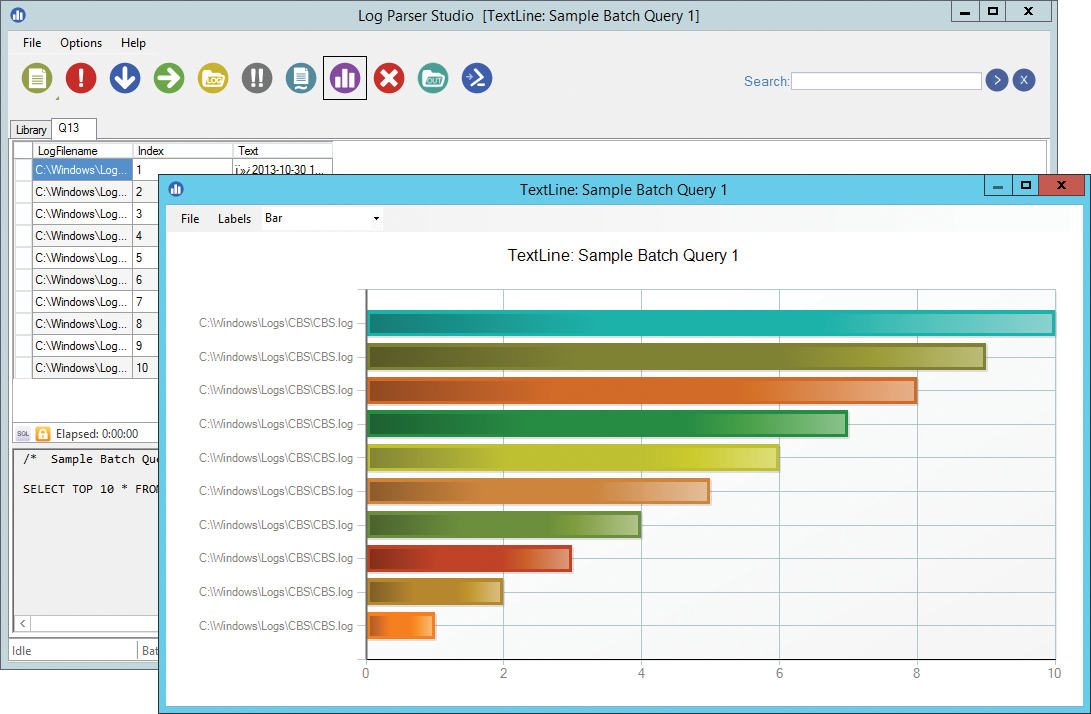
Log Parser Studio gives you a basic graphical representation. This uses the first two columns of a table, but only works if the second column of this table contains numeric values. The first column can be of any type. For multicolumn tables, you can subsequently drag and drop the column to be evaluated to the second position. Then, in the button bar, if you click the fourth icon from the right, you will see a visualization of the values as a graph (Figure 2).

By default, the output is a bar chart. You can choose from other display types via the drop-down box in the menubar of the window. Additionally, more complex tables can be exported using the fourth icon from the left (the right arrow on a green background) for further processing in Excel as a CSV file.
Sorting Results Correctly
Before I now turn to other types of logfiles, another weak point of the graphical user interface still needs to be mentioned. If you subsequently try to sort the results of a query in the table view, you will notice that this does not work properly. To sort by this value, click on the header of the Logons column, as in the output of the previous example.
The result unfortunately does not conform with expectations, because the display does not sort the numbers by amount, but by digit. The result is a string like "1, 10, 12, 15, 2, 21, 3, …" and not the ascending order of the values. Exporting the data into another program and anchoring the desired sorting directly in the query by adjusting the appropriate SQL clause are possible alternatives. For example, change the last line of the example to:
ORDER BY [Logons] DESC
Now the second column is sorted in descending order in Log Parser Studio, and the day with the most failed logons appears at the top.
Evaluating Text Files
That exercise was great for getting started, but up to this point, I have only used the event log as a source of information. However, Log Parser Studio's true strengths lie in accessing text-based logs – in particular if the systems to be evaluated distribute their information across numerous files. Internet Information Services (IIS) and Exchange are prominent representatives in this category.
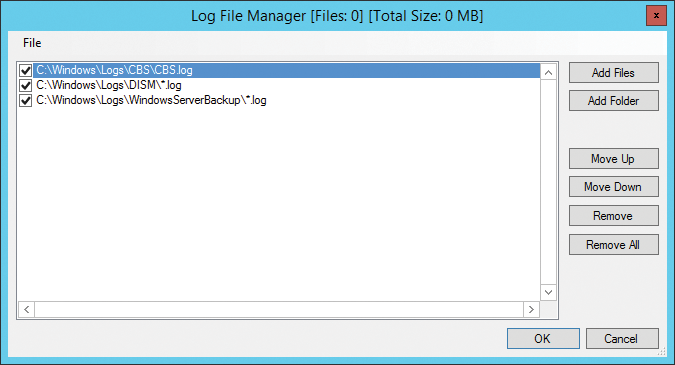
Up to Windows Server 2003 R2, IIS saved its logs by default in the C:\WINDOWS\system32\LogFiles\W3SVC1 directory; newer systems store their logs under C:\Inetpub\Wwwroot logs\LogFiles\W3SVC1. Call up the Log File Manager in Log Parser Studio by clicking on the fifth icon from the left. The manager opens in a separate dialog. Now, you can select either individual logfiles or whole folders using the Add Files or Add Folder buttons. Navigate to the desired location in the following Explorer window. Even if you have opted for the Add Folder option, you need to select at least one file here.
The Log File Manager automatically replaces the file with a wild card and processes all files in the selected folder. You have more control using the Add Files option. If you add files to the analysis in this way, they are individually listed in the Log File Manager and can be activated or deactivated individually for queries using the checkboxes (Figure 3). This method is useful for switching between sets of logs quickly if you want to work in various queries on files with different paths or file types.

Querying IIS Logs
Queries relevant to the web server start with "IIS" and others start with "HTTPERR." If you run the IIS: User-agent report query against a set of IIS logs, you will receive a list of the accessing client browsers grouped by the user-agent string that the clients submit. The user-agent string is a combination of operating system and browser and is not necessarily easy to understand at first glance.
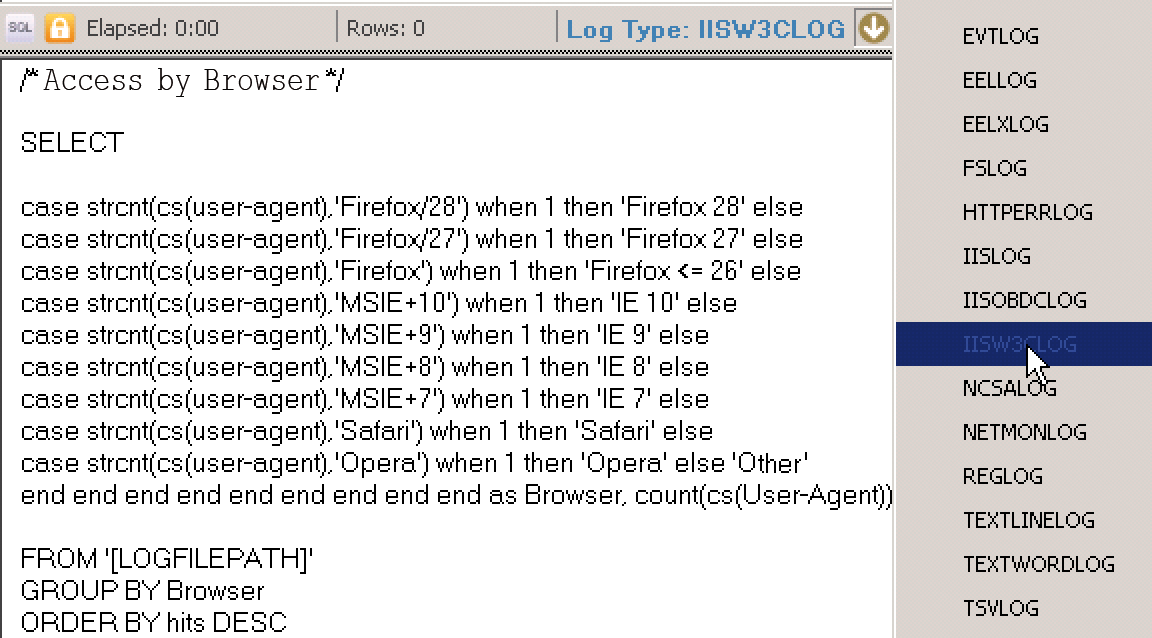
A user-defined query makes the information easier to read. Select File | New | Query in the menu and change the log type from NOT set to IISW3 CLOG via the drop-down menu above the query editor (Figure 4).

In the editor box, add the query to evaluate by browser name (Listing 1) and execute the query. The result is a list of accessing browsers in descending order. Of course, you can vary the CASE statements as required to output more browser types separately.
Listing 1: Access by Browser
01 SELECT
02 CASE strcnt(cs(user-agent),'Firefox/28') WHEN 1 THEN 'Firefox 28' ELSE
03 CASE strcnt(cs(user-agent),'Firefox/27') WHEN 1 THEN 'Firefox 27' ELSE
04 CASE strcnt(cs(user-agent),'Firefox') WHEN 1 THEN 'Firefox <= 26' ELSE
05 CASE strcnt(cs(user-agent),'MSIE+10') WHEN 1 THEN 'IE 10' ELSE
06 CASE strcnt(cs(user-agent),'MSIE+9') WHEN 1 THEN 'IE 9' ELSE
07 CASE strcnt(cs(user-agent),'MSIE+8') WHEN 1 THEN 'IE 8' ELSE
08 CASE strcnt(cs(user-agent),'MSIE+7') WHEN 1 THEN 'IE 7' ELSE
09 CASE strcnt(cs(user-agent),'Safari') WHEN 1 THEN 'Safari' ELSE
10 CASE strcnt(cs(user-agent),'Opera') WHEN 1 THEN 'Opera' ELSE 'Other'
11 END END END END END END END END END as Browser, count(cs(User-Agent)) as Hits
12 FROM '[LOGFILEPATH]'
13 GROUP BY Browser
14 ORDER BY Hits DESC
Blogs and forums on IIS and Exchange offer numerous suggestions for further queries [4]. These are often written as the Log Parser command-line tool. However, it is usually sufficient to replace the path to the logfiles in the FROM clause with the variable '[LOGFILEPATH]' so that the query works in Log Parser. This way, the following query resolves the accessing IP addresses to their hostnames and displays the results in Studio as a table:
SELECT c-ip As Machine,
REVERSEDNS(c-ip) As Name,
COUNT(*) As Hits
FROM '[LOGFILEPATH]'
GROUP BY Machine ORDER BY Hits DESC
Because of the reverse DNS lookup for each IP address, this query can run for a very long time depending on the volume of log data. As an alternative to outputting the results directly in the GUI, you can redirect the output to a file. In the previous example, add an INTO clause before the FROM statement:
[...]
INTO '[OUTFILEPATH]\Hostnames.CSV'
FROM '[LOGFILEPATH]'
[...]
Log Parser Studio writes the results in the Hostnames_[date]_[time].CSV file. You can change the destination directory in the Default Output Path field in the Options | Preferences menu. You can also uncheck the Auto-open output file box there. Otherwise, Log Parser attempts to open the file and complains if neither Excel nor another program with the file extension CSV is linked to the local system.
Batch Processing and PowerShell
Via the batch manager, you can run multiple queries in parallel in multithreading mode; this is useful if a large amount of data needs to be processed. If you prefer to execute the queries sequentially for performance reasons, check the fourth box, Run batched queries, in the Options | Preferences menu. Then, highlight the desired queries in the library, right-click to pop up the shortcut menu, and choose Add to batch. You can then start batch processing via the ! icon or by pressing Execute in the batch manager. One constraint is that all batch queries work on the same set of logfiles; unfortunately, it is impossible to assign different input data to individual queries.
As an alternative to interactive execution in Log Parser Studio, you can also export queries as PowerShell scripts, using the first icon from the right, and thus even run them on systems without Log Parser Studio. The only requirement is that the Log Parser command-line tool is installed. However, when exporting, the [LOGFILEPATH] variable is resolved, and the names of the files activated in the Log File Manager end up in the script.
Thus, you should configure a folder before exporting instead of individual files so that a path with a wildcard is written to the script. With this, the script can be transferred more easily to another system and will work regardless of the actual file names in the log directory. A further peculiarity is that an exported query writes its output by default to the Documents profile folder of the executing user. If you want to change this, call up the script using the -OutFile switch:
.\hostnames.ps1 -OutFile c:\temp\hostnames.csv
This way, you can set up Log Parser queries, scheduled tasks, and automatically execute them.
Evaluating Exchange Logs
The differences between IIS and Exchange are not huge, because Exchange's Client Access server (CAS) role is based on IIS. Accordingly, you can track down the activities of Outlook Web Access, Exchange Web Services, and ActiveSync on the CAS with the logs in the C:\inetpub\logs\LogFiles\W3SVC1 path. For ActiveSync access only, you can try a variant of the browser query, sorted by client platform (Listing 2).
Listing 2: Access by ActiveSync Client
01 SELECT
02 CASE strcnt(cs(user-agent),'iPhone') WHEN 1 THEN 'iPhone' ELSE
03 CASE strcnt(cs(user-agent),'iPad') WHEN 1 THEN 'iPad' ELSE
04 CASE strcnt(cs(user-agent),'SAMSUNG') WHEN 1 THEN 'Samsung' ELSE
05 CASE strcnt(cs(user-agent),'Android') WHEN 1 THEN 'Android variant' ELSE 'Other'
06 END END END END as DeviceType, cs-uri-stem AS Vdir, Count(cs(User-Agent)) as Hits
07 FROM '[LOGFILEPATH]'
08 WHERE cs-uri-stem LIKE '%Microsoft-Server-ActiveSync%'
09 GROUP BY DeviceType, Vdir
10 ORDER BY Hits DESC
In addition to statistical analysis in normal operation, Log Parser Studio is also a great help if you have an Exchange Server with a high CPU load or excessive data growth on the log partition of a database. Such symptoms can be triggered by a single faulty ActiveSync client. A well-known example was a now-fixed bug in Apple iOS 6.1, with which a single iPhone was capable of flooding the log partition [5].
If the error is known, in this case an exception of type WrongObjectTypeException, Log Parser Studio delivers the culprit (Listing 3). Even without knowledge of the error text, however, you can identify rogue ActiveSync clients. If a log partition fills up in a short amount of time, without obvious growth of the associated database, you will often see massive ActiveSync access by a client at the same time (Listing 4).
Listing 3: Searching for the Error Source
01 SELECT Cs-username AS User,MyDeviceId AS DeviceId, COUNT(*) AS Hits
02 USING EXTRACT_VALUE(cs-uri-query,'DeviceId') AS MyDeviceId
03 FROM '[LOGFILEPATH]'
04 WHERE cs-uri-query LIKE '%Error:WrongObjectTypeException%'
05 GROUP BY DeviceId,User
06 ORDER BY Hits DESC
Listing 4: Top 10 ActiveSync Users
01 SELECT TOP 10 cs-username AS UserID, cs(User-Agent) AS DeviceType, cs-uri-stem AS Vdir, c-ip AS CLIENT, Count(*)
02 FROM '[LOGFILEPATH]'
03 WHERE cs-uri-stem LIKE '%Microsoft-Server-ActiveSync%'
04 GROUP BY UserID, DeviceType, Vdir, Client
05 ORDER BY COUNT(*) DESC
High CPU load on the CAS can also be caused by ActiveSync [6]. With Log Parser Studio, you can identify the client to renew its Exchange configuration or, in the most extreme case, to reset the device to the factory settings.
Conclusions
Microsoft's Log Parser Studio is a useful free tool for admins. Of course, the tool might not be able to replace central log collection and analysis systems. Despite this, however, it makes your first steps in this field easier and helps to ensure a rapid response in the event of a fault. The prefabricated queries and numerous examples on the web already cover many practical cases. With a pinch of SQL expertise [7], you can easily modify these and develop your own queries.
