
Top-like tools for admins
The Tops
One of the first lessons I learned when I became an admin was that you don't always have a nice GUI console to servers, particularly if the server is misbehaving (i.e., not acting normally). Problems that crop up usually mean no X Window system or any other sort of GUI access to the server. Often, this also means that monitoring tools such as Ganglia [1] aren't giving you much or any information.
Typically, you can only manage either a simple SSH login or maybe a crash cart connected to the server, or maybe a KVM (Keyboard, Video, Mouse) connection to the server. Moreover, most of the time in the HPC world, the compute nodes don't have a graphics card suitable for running a GUI. Therefore, you are left with a simple ASCII terminal window.
What tools can help you? Fortunately, Linux and other *nix operating systems come with some command-line tools that can help you diagnose the problems.
Interestingly, these common *nix tools have spawned the development of similar tools with added capability or slightly different features. Although the original *nix tools are really useful, many of these lookalike tools are outstanding.
If I only have terminal access to a misbehaving server, either through an SSH login or maybe a crash cart plugged into the server, the first thing I do is to run the command top. In this article I want to cover what Top does and what other Top-like tools are available. Some of these tools may be familiar and some may be new, but I've found them to be very useful and sometimes wildly creative.
top
When I get a login to the server, the first tool I run is Top, because I get a quick summary of the status of the system. Let me explain with an example. Figure 1 is a screen shot of my desktop when I was running Python code test3.py (a long-running processor- and memory-intensive piece of Python code).
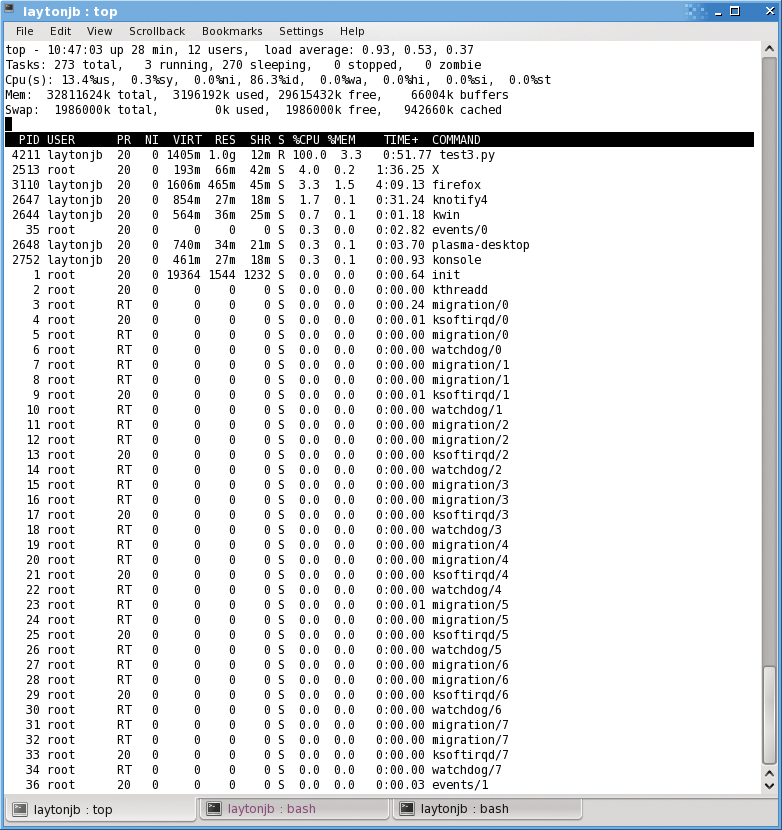
At the top of the image is a summary area of five lines. The first line, shown in Figure 2, presents a quick status of the system overall. The first number is the current time (10:47:03). The second number is how long the system has been up (28 minutes), how many users are on the system (12 users – just a number of terminals in my case), and the 1-minute, 5-minute, and 15-minute loads on the system.

The second summary line (Figure 3) lists the number of total tasks (273), the number of running tasks (3), the number of tasks sleeping (270), the number of tasks stopped (0), and the number of zombie tasks (0).

The third summary line (Figure 4) presents CPU information. Moving left to right, the first number here is the percent CPU from userspace (%us, i.e., user applications), which is 13.4% in my example. The second number is percent CPU load from the system (0.3%sy), and the next is percentage of jobs that are "nice" [2] (0.0%ni). After that, Top lists percent overall CPU time idle (86.3%id; four real cores and four hyper-threading cores on this system) followed by percent overall CPU time waiting for I/O (0.0%wa), percent overall CPU time spent servicing IRQs (0.0%hi), percent time servicing soft IRQs (0.0%si), and percent overall CPU steal time (0.0%st).

The fourth summary line (Figure 5) is devoted to physical memory statistics. Reading from left to right, the first number is the total amount of memory (32,811,624KB, or about 32GB). The second number is the amount of memory used (3,196,192KB, or about 3GB). Next is the amount of free memory (29,615,432KB, or about 29GB), and the last number is the amount of memory used by kernel buffers in the system (66,004KB, or about 66MB).

The fifth summary line (Figure 6) focuses on the swap space in the system. From left to right in my example are the total amount of swap space (1,986,000KB, or about 2GB), the amount of swap space used (0KB), the amount of swap space free (1,986,000KB, or about 2GB), and the amount of cached memory used (942660KB, or about 1GB).

After the summary section is the process section. In this section, all of the running processes that can fit on the screen are ordered by CPU usage, with the largest first down to the smallest. The columns here correspond to the list in Table 1, which also indicates the values for the columns associated with my application, test3.py:
Tabelle 1: Process Section of Top Output
|
Heading |
Description |
Application Value |
Note |
|---|---|---|---|
|
PID |
Process identifier [3] |
4211 |
|
|
USER |
Username of the owner of the process |
laytonjb |
|
|
PR |
Priority of the process |
20 |
|
|
NI |
Nice value of the process |
0 |
That is, the application isn't niced |
|
VIRT |
Amount of virtual memory used by the process |
1405m |
1,405MB |
|
RES |
Amount of physical memory used by the process |
1.0g |
1.0GB |
|
SHR |
Shared memory used by the process |
12m |
12MB |
|
S |
Status of process |
R |
S = sleeping, R = running, Z = zombie |
|
%CPU |
Percent CPU being used by the process on a per-CPU basis |
100.0% |
That is, it is using 100% of the core |
|
%MEM |
Percent memory used by the process |
3.3% |
Percentage of the total memory available |
|
TIME+ |
Total time of process activity |
0:51.77 |
51.77 seconds, meaning he application had just started |
|
COMMAND |
Name of the process |
|
Top outputs a great deal of information in a small amount of space, which is exactly why I use it: to get a quick overview of what is happening on the server. In this particular case, not too much is happening that's critical, but the server isn't misbehaving.
In the case of a misbehaving server or application, I determine the state with a quick look at a few key values, such as the load average on the top line to see if the load is much higher than expected. If the load is greater than the number of cores, you might suspect that an application is running away or perhaps swapping.
On the second line, I look for zombie processes (never a good thing), and I look at the number of applications (total tasks). If the data on that line looks logical, you probably don't need to worry too much.
On the third line, I examine the system (%sy), nice (%ni), and I/O wait time (%wa) percentages to see if the system is having issues. In particular, I'm looking at the I/O wait time. If it is too high, it means the application is waiting on I/O and that the I/O is possibly a bottleneck. At the same time, I like to watch the system CPU percentage. If it is larger than normal, I know something is going on with the system. For example, if the node starts swapping, this CPU percentage will go up.
On the fifth summary line, the metric I focus on is the used swap space, a high number indicates that the system is swapping, which can be a root cause of a system running really slowly. I also like to look at the amount of free memory in the fourth line. If this number is really low and the buffer and cached numbers are low, the system might be running out of memory.
In the process section, I look first at the top few applications to see whether any system applications are near the top, perhaps indicating a problem. I also like to look at the %CPU and %MEM for all user applications.
I've used Top enough that I can scan these numbers and quickly note potential sources of problems. Top has saved my bacon more than once.
htop
People have created various versions of Top, and one of the better ones is called htop [4]. Htop is a bit more interactive than Top, but it provides very similar information. The screenshot in Figure 7 is htop running on my desktop while running the test3.py code.
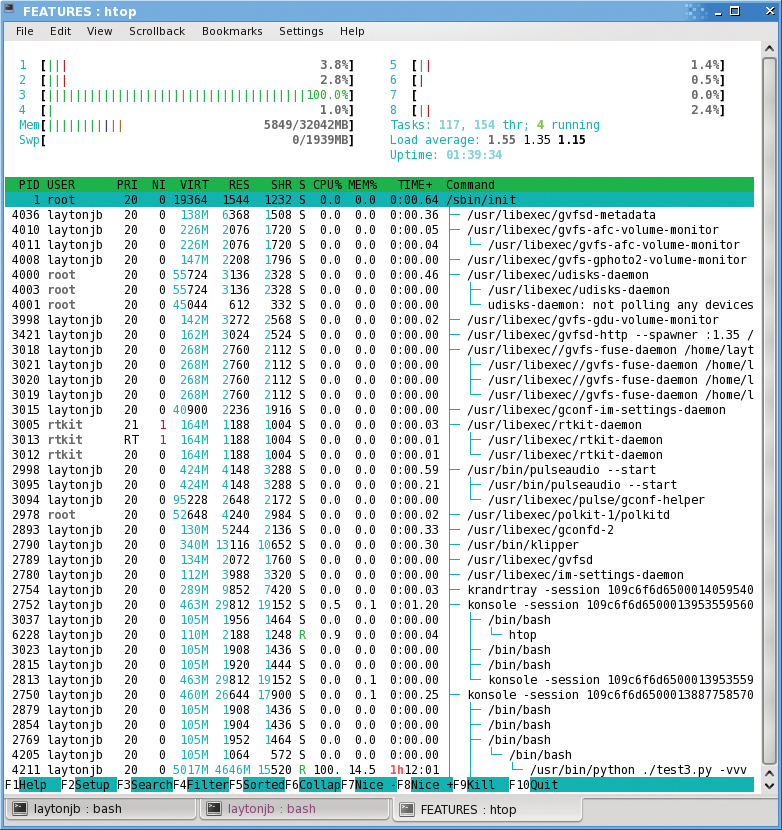
Htop uses ncurses [5] for the interface but reads the data from /proc as Top does.
Building htop is fairly easy. I downloaded the latest version (1.0.3) from the htop web page and then followed the usual rules of ./configure; make; make install. Htop installs by default in /usr/local/bin; make sure this is in your path if you want to use htop without specifying the entire path to the command.
Htop has some advantages relative to Top. The website [6] lists the following differences:
- In htop, you can scroll the process list vertically and horizontally to see all processes and full command lines.
- In Top, you are subject to a delay for each unassigned key you press (especially annoying when multikey escape sequences are triggered by accident).
- Htop starts faster, whereas Top seems to collect data for a while before displaying anything.
- In htop, you don't need to type the process number to kill a process – in Top, you do.
- In htop, you don't need to type the process number or the priority value to re-nice a process – in Top, you do.
- In htop, you can kill multiple processes at once.
- Top is older, hence more used and tested.
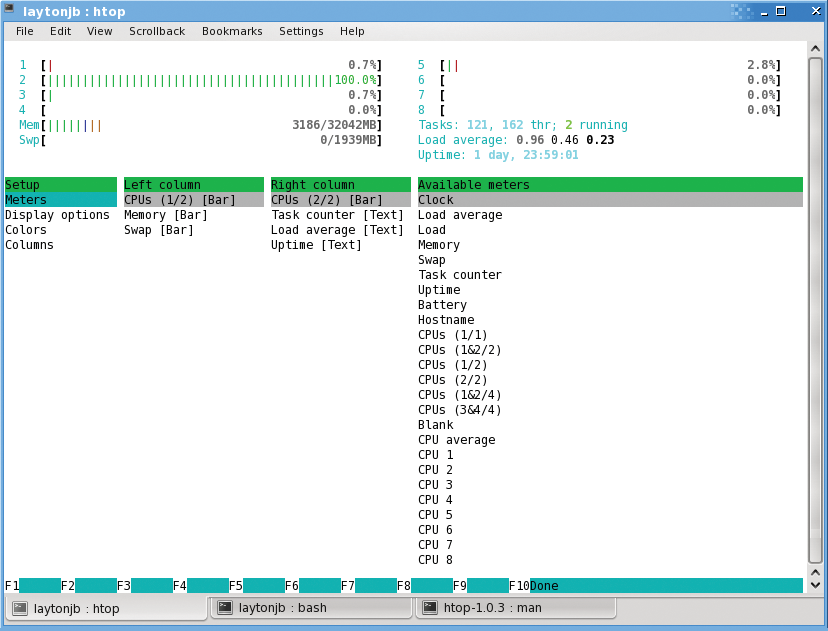
I've found htop to be more useful in filtering and displaying details of what is running than Top. Figure 8 shows what happens when you hit F2 after htop starts. By using the arrow keys, you can add and remove certain metrics (Meters) from the display.
Another feature I use often use is the filter option. By pressing F3, you can filter processes by UID. In Figure 9, I filtered the processes by laytonjb. The output is a nice tree of processes that you can collapse by pressing F6, as shown in Figure 10.
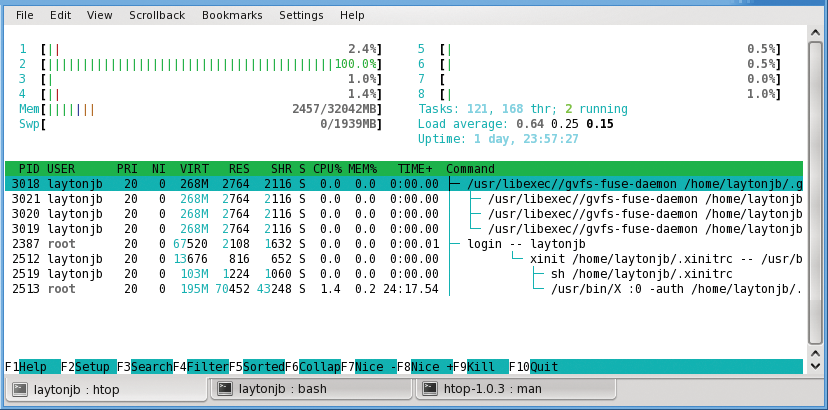
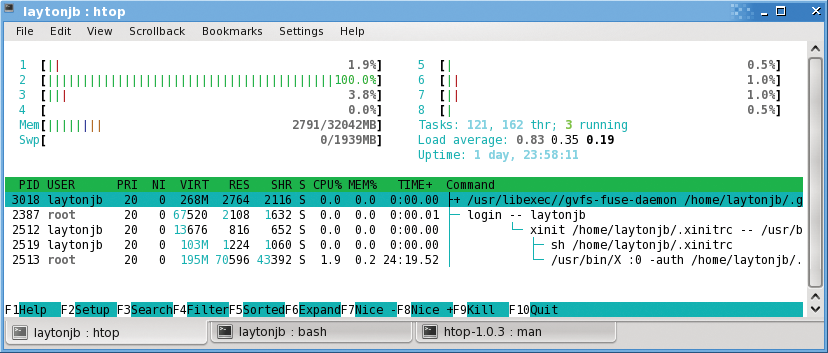
Htop is a flexible version of Top that gives you much the same information, but it has lots of flexibility, allowing you to customize your view of what's happening on the system. You can also do many things from within htop without having to open another shell or dropping out of Top. For example, if I see a process that I need to kill, I can do that from within htop. If the process can't be killed or shouldn't be killed, I can just nice the process, allowing other processes to have a higher priority.
atop
Another really good effort in creating an enhanced Top tool is called atop [7]. Although it retains Top's concept of a system summary at the top and processes listed below, it rearranges the interface a bit and makes some additions. These extra items really make it more of a general ASCII monitoring tool than a Top-like tool. Nonetheless, I consider it to be in the Top family.
As with many tools, you can use lots of options with atop (Figure 11), but by default, you get the split-screen view. The top portion summarizes the state of the system, and the lower half lists the processes.
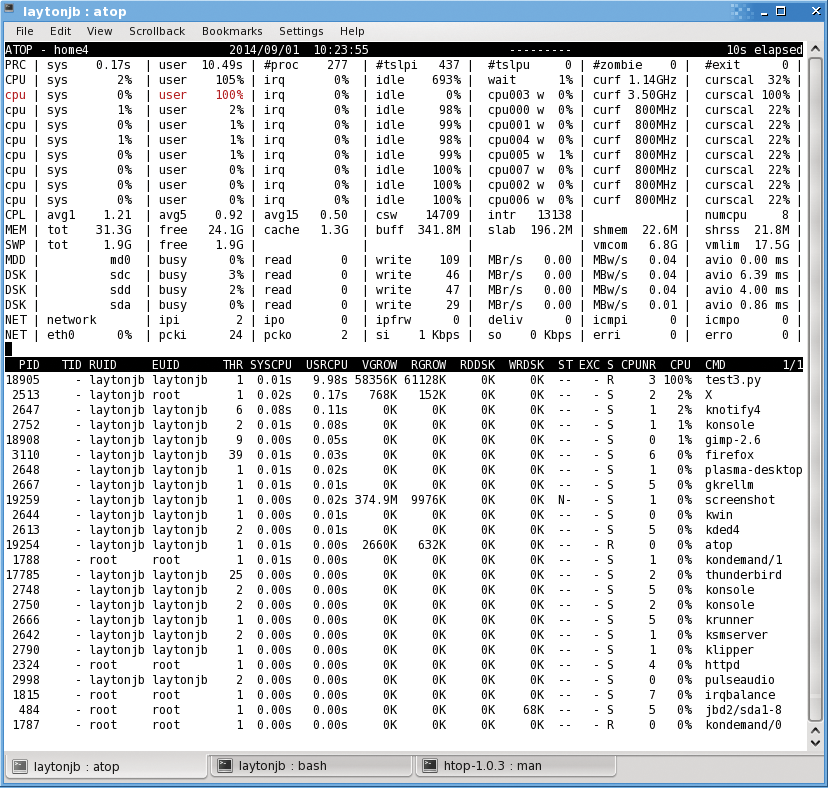
The summary at the top covers processor, memory, disk, and network information. Atop adjusts the information according to the screen size, which can be a little disconcerting, because some information might not be where you expect it if the window size changes; however, it is very handy because it gives you useful information regardless of screen size (within reason).
One place I've found atop to be very useful is if you are using low-resolution displays to log in to a node. For example, I've used my seven-inch tablet to SSH into misbehaving servers, and I've found atop to be extremely handy, because I can get lots of useful information in a small screen – although the silly on-screen keyboard drives me nuts, requiring me to use a Bluetooth keyboard.
I won't cover the screen information of atop in detail because there is a lot of it. I do recommend reading the man page [8] for more details. When I started using atop, I was a little overwhelmed by the man page, so I just ran a variety of applications and used atop to monitor them. In this way, I was able to get a feel for what aspects I naturally watched for various types of applications (e.g., an application with lots of I/O, lots of network communication, or lots of memory bandwidth). This type of experimentation helps you develop habits with any given tool.
Atop has several options you can use to change the information what appears in the bottom half of the screen. The atop page [9] has some screenshots that show what happens when you invoke some options. For example, you can use the s key to look at scheduling details, the m key to see memory usage, d to look at disk usage, v to look at the "variable" information, c to show the command line for various processes, p to see accumulated information on a per-process basis (e.g., CPU consumption, memory consumption), u to see system information on a per-user basis (one of my favorites), and n to see network information on a per-process or per-thread basis if you use an optional module called netatop.
psutil: Create Your Own Top
DevOps [10] is a term used to describe what most admins have been doing for years – writing code in addition to administering their systems. Python [11] is one of the most popular languages used for DevOps. People have been developing Python modules (libraries) for applications and monitoring systems that have proven to be very useful, and one fantastic library is psutil [12].
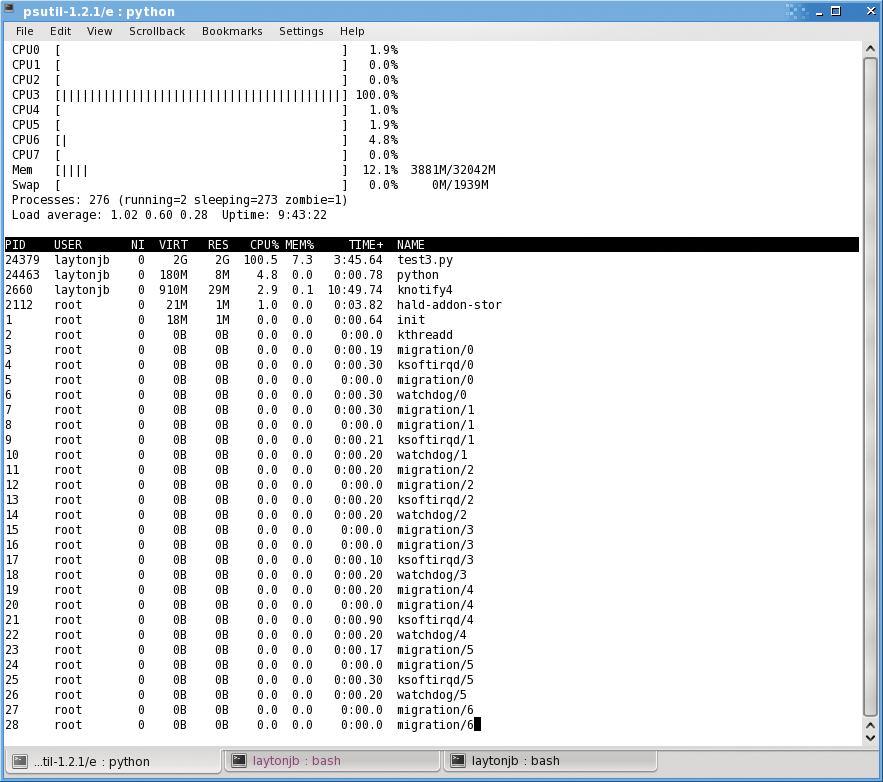
Psutil is a cross-platform library for gathering information on running processes and system utilization. According to the website, it currently supports Linux, Windows, OS X, FreeBSD, and Solaris. It has a very easy-to-use set of functions and can be used to write all sorts of useful tools. In fact, the author of psutil wrote a Top-like tool [13] in a couple of hundred lines of Python, which I'll refer to it as ptop, even though the author calls it just top.py. I'll briefly talk about this code as an example of what you can accomplish if you want to roll your own Top tool. That in itself is worth a mention.
Ptop (Figure 12) doesn't really do anything beyond the classic Top tool, but because the code is simple, it is fairly easy to modify to implement your own features and capabilities. If you compare Figure 12 with Figures 1 (Top) and 7 (htop), you can see that the simple Python code creates output that is very close to both, particularly htop. The code has no real options, but, again, you can customize it to your needs.
vtop
Finally, one more Top-like tool that I just learned about is the new and innovative vtop [14]. I think of it as a real-time ASCII charting tool for node performance. GUI tools such as Ganglia provide good charts of node performance, but what happens when you just have an SSH login to the node? A real-time chart might be nice to help you see what's happening on the node.
This is where vtop comes in. Vtop creates two ASCII charts at the top and bottom of the output. The top chart shows the overall CPU activity as a percentage of the total. The bottom left chart shows the memory usage as a percentage of the total. At the bottom right, a window lists the top processes sorted by CPU percentage.
Vtop uses Node.js [15] as its basis, so you need to install that first. After Node.js is installed, just run the following command as root and vtop is installed for you:
npm install -g vtop
On my CentOS 6.5 system, it was installed as /usr/bin/vtop, which makes it very easy to run. Figure 13 shows a screen capture of vtop when running the sample Python code.
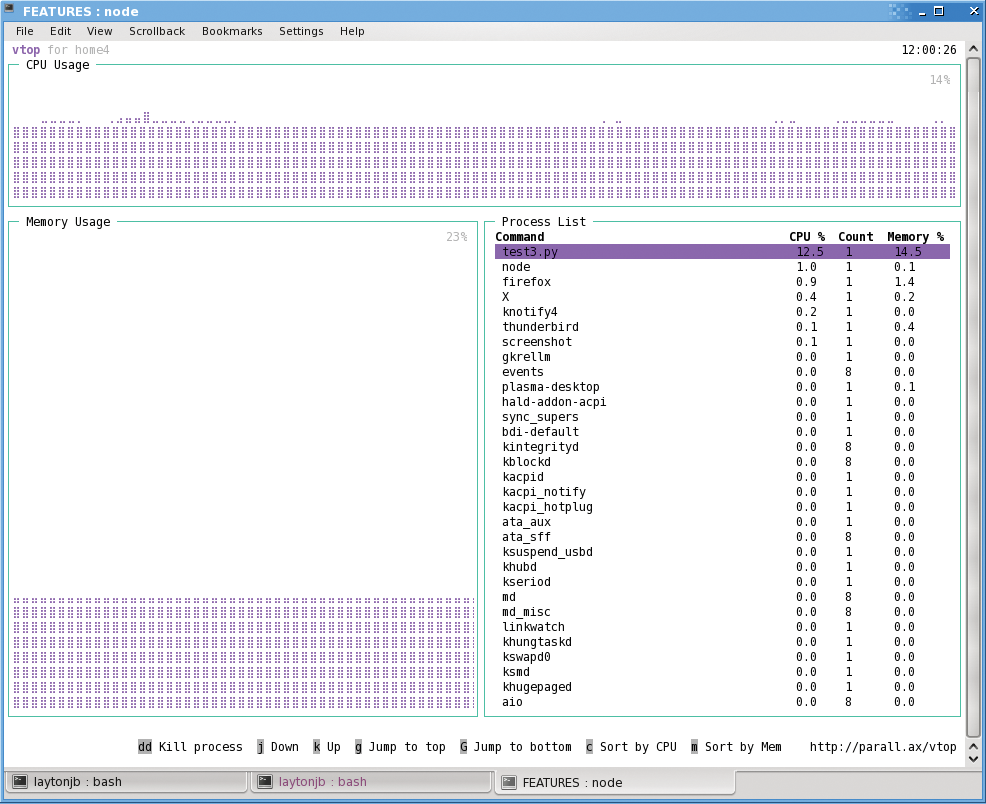
Vtop has some interactive capability, as you can see at the bottom of the screen, but to be honest, I've just started working with vtop, so I don't have much experience with it yet. I find the beautiful ASCII real-time graphs to be very useful in understanding what's going on with CPU usage and memory usage.
Be sure to test vtop on the terminals you use. In a fit of nostalgia, I tried it on rxvt [16], and it didn't work too well, but I hope to use vtop more in the future.
Summary
If you're going to answer the call when things go wrong, you need tools to solve problems. Without knowing what is causing the problem or even what the problem is (e.g., "my application is running slow"), the first tool I reach for is Top.
Top gives me a quick snapshot of what is happening on the server, and because it's ASCII based, I can pretty much run it on any server, as long as I can get a shell, SSH, or even a crash cart to the server.
Using Top, I can see running tasks or processes, what is happening on the processors, and memory usage (although that is not always easy to understand with Linux). Sometimes, however, Top didn't give me all the information I wanted, so I started learning about and using other Top-like tools.
In this article, I covered a few tools that you might find useful. In addition to Top, I talked about htop, atop, ptop (roll your own top tool), and vtop. To be honest I use top, htop, and atop quite often, usually in that order, but I might take DevOps to heart and use ptop to create my own Top-like tool someday. The last tool, vtop, is new and creative and shows a great deal of promise for examining real-time ASCII charts. I'm really excited to learn more about vtop and how I can use it.
