
Network monitoring with Icinga and Raspberry Pi
Close Watch
The admirable efforts of the Raspberry Pi Foundation have been providing an excellent single-board computer (SBC) that can be applied to almost any need. A simple Raspberry Pi can become a robot, a beer brewing sensor, and even a home media center.
In this article, I will show you how to apply a Raspberry Pi and the network monitoring software Icinga to monitor your networks.
Many people have networks and servers – physical, virtual, cloud, or otherwise – that they want to monitor. For example, you might want to keep tabs on your LAN at home, check in on a remote office, or even monitor your Bitcoin mining rig. Network monitoring is extremely helpful in maintaining an IT infrastructure.
Network monitoring gives you deep insights into what is up, what is down, what is having problems, and network dependencies. You can check availability and be notified of outages.
Over time, performance data can even help you see trends that allow you to address them proactively. You can delve deeply into your routers, switches, firewalls, and servers and understand what's going on in your networks. At a fundamental level you gain actionable insights on maintaining uptime for your networks and servers. Unfortunately, the powerful yet sometimes underutilized tools of network monitoring are often not given the limelight. In this article, I will explore one such unsung technology hero of IT uptime – Icinga.

Icinga
Icinga [1] is feature-rich, impressive, open source network monitoring software [2]. Started in 2009, Icinga began as a fork of the Nagios project. The creators focused their attention on a modern web interface, a REST API, and support for a wider array of databases. Because Icinga was forked from Nagios code, it maintains compatibility with Nagios plugins [3]. Some of Icinga's key features are:
- Flexible and scalable architecture.
- Sleek web interface.
- Intuitive, template-based configuration.
- Remote monitoring support.
- Plugin compatibility with Nagios.
- Monitoring services on ICMP (ping) or a variety of services (HTTP, DNS, IMAP, POP3, SMTP, etc.).
- Notifications via alerts on SMS, email, Jabber, etc.
- Support for Livestatus and Graphite.
- Support for additional databases such as Oracle or PostgreSQL.
- Command-line tool with command completion (Icinga 2).
- Icinga Mobile (for iPhone and Android).
Herein, I focus on the Icinga 1.7.1 release in the existing repositories.
Raspberry Pi
The Raspberry Pi SBC packs some high-quality hardware at a very affordable price. It's compact and requires very little power, and for less than $100, you can build a feature-rich network monitor (see the "What You Need" box). The current version, the Raspberry Pi Model B+ [4] (Figure 1), continues a history of iterative improvements.
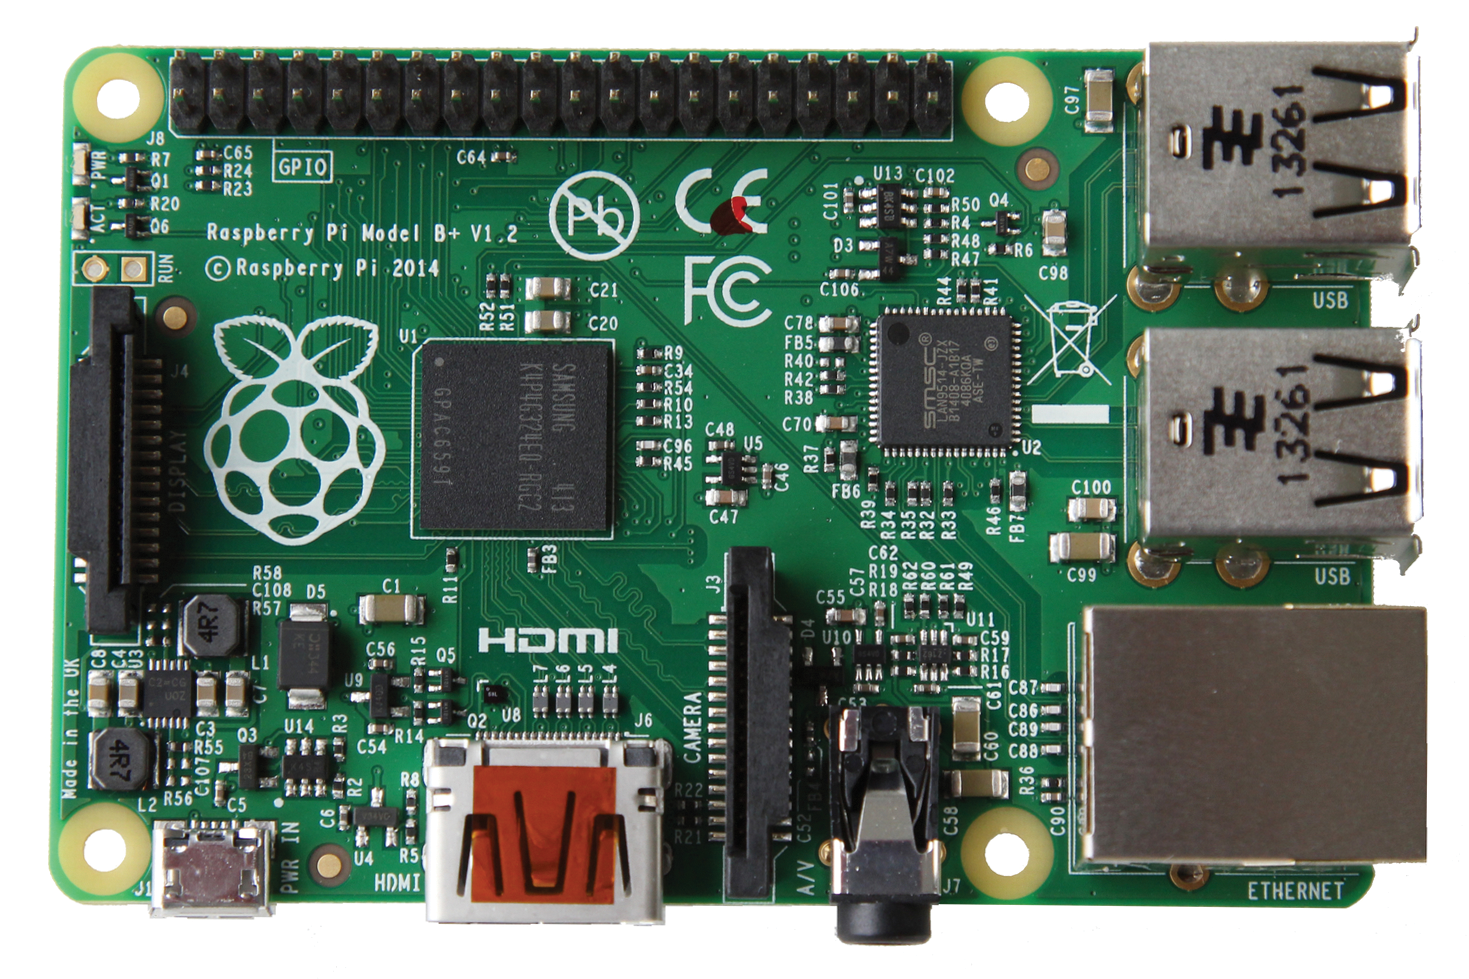
This new model sports better power consumption, greater I/O, and an even greater array of connectivity options. It is perfect for a project like this that needs a simple, low-power solution but not a full-blown power-guzzling server. For the purposes of this article, my operating system of choice is Raspbian "Wheezy" (i.e., Debian Linux). This can be found in the download section of the Raspberry Pi website [10].
Putting together your system is as easy as pie; simply connect your monitor via HDMI, connect your USB keyboard, connect the Ethernet cable, plug in your MicroSD card, and power up your Pi by plugging in the Micro USB. Once running, you need to log in and set it up. The default username for Raspbian is pi and the default password is raspberry.
Before going live on any network, a machine should be fully patched and updated. Nothing can shield you from zero-day attacks, but you can address any known security issues and bugs. Patching is critical in all cases – even with a simple project such as this. To begin, you should update and upgrade Raspbian, then update the firmware and reboot:
$ sudo apt-get update && sudo apt-get upgrade
$ sudo rpi-update
$ sudo reboot
Your Pi will boot into a configuration program called raspi-config (Figure 2). Navigating it is much like navigating the BIOS or ncurses application where you use the Up, Down, Right, and Left arrow keys and the Tab and Enter keys to navigate and configure the options. Of the many available options, you only need to worry about making changes to a handful of configuration variables.

Expand Filesystem (option 1). Base install images are 2GB, so when you first install or flash Raspbian "Wheezy" to your SD card, it will not show all the available space. Expanding rootfs will expand the root partition to fill the SD card and show the total storage capacity. After a reboot, I saw a full 32GB available. To be sure you have access to all your SD card storage, enter df - hl.
Change User Password (option 2). Keeping the default username and password is never a good idea; you want to change your password to a more secure choice.
Memory Split (option 8). This option is listed under Advanced Options. Your Pi by default is configured to split or share the available memory between both the ARM CPU and the GPU (graphics card). The default configuration is to split it 192MB ARM/64MB GPU, but you want to change this to 240MB ARM/16MB GPU because you are not planning to run anything other than a server "headless" (i.e., without a monitor), so you really don't need to waste memory on the GPU.

Configuring the Server
Because the Rasp Pi will function as a server, you should set it up to have a static IP on the network. Afterward, you can disconnect the monitor and keyboard and operate the Pi in headless mode. Be sure to give the Rasp Pi an address that isn't within your DHCP range. In this case, you want to go into the interfaces configuration file,
cd /etc/network
sudo nano interfaces
and change the line that begins iface eth0 inet from dhcp to static, then define the address, netmask, and gateway as follows:
iface eth0 inet static
address 192.168.7.50
netmask 255.255.255.0
gateway 192.168.7.1
The address reveals that the network is private, that is, an RFC 1918 private network address space. I'm assuming you are using some form of hardware firewall in addition to your server iptables configuration.
If you are interested in rolling your own firewall, then the world of Linux is the place to start. You can build on any distribution or use firewall-focused distros, such as Endian, Untangle, pfSense, or Smoothwall, to name a few. These can be built with conventional desktop-server hardware or in embedded configurations.
To set up name resolution, begin by editing your /etc/resolv.conf to point to the DNS server correct for your network or ISP. For my setup, that is:
pi@raspberrypi ~ $sudo nano resolv.conf
nameserver 192.168.7.1
Of course, you could run X11 over SSH and even VNC, but that would just take away from the power you want to give your server. Besides, servers don't need resource-wasting GUIs – the command line is a better, leaner and faster path.
Securing the Pi
For any system you connect to a network, you should be sensitive to security best practices. In the case of the Pi, you want to make a few changes that will lessen the chances your box becomes a cybercriminal casualty. I recommend three actions, but in the interest of focusing on the configuration at hand, I'll not cover them other than to mention them:
1. Harden your SSH configuration with key-based authentication – or even multifactor authentication with YubiKey or other technology – and a strong password.
2. Create firewall rules that only open what you required on both your servers and your network firewall.
3. Set up automated updates.
Obviously, there is no such thing as a secure system other than one that is powered off, disconnected from any network, and encased in a Faraday cage. Nonetheless, you should always do your part to avoid the propagation of malicious code.
Having default users are a bad security practice, so I usually opt either to disable the default accounts or change the username. In this case, I add a new user and put it in the sudo file, so the user can sudo as needed,
sudo adduser sweetpi
sudo adduser sweetpi sudo
and then disallow the default Pi account. Thereafter, I suggest you deny that user any access via your SSH configuration.
Once your system is set up, patched, and ready to go, you can install Icinga and its related applications.
Installing Icinga
Icinga installs easily with:
sudo apt-get install icinga icinga-doc
Be sure to set a secure database and icingaadmin password and make note of them.
I have specifically not set up the IDO2DB utility [11] in this configuration because it imposed too much of a load on my Raspberry Pi. The Icinga Data Out Database is storage for historical data for add-ons and the web interface.
Once everything is installed, you can go to the browser of your choice, visit http://ipaddressofofyourserver/icinga, enter the username icingaadmin, and enter the password you selected during setup.
As you can see in the Tactical Overview window (Figure 3), Icinga monitors the system on which it is installed by default. You will see it is already performing ICMP (ping) checks and displaying system load and disk space.
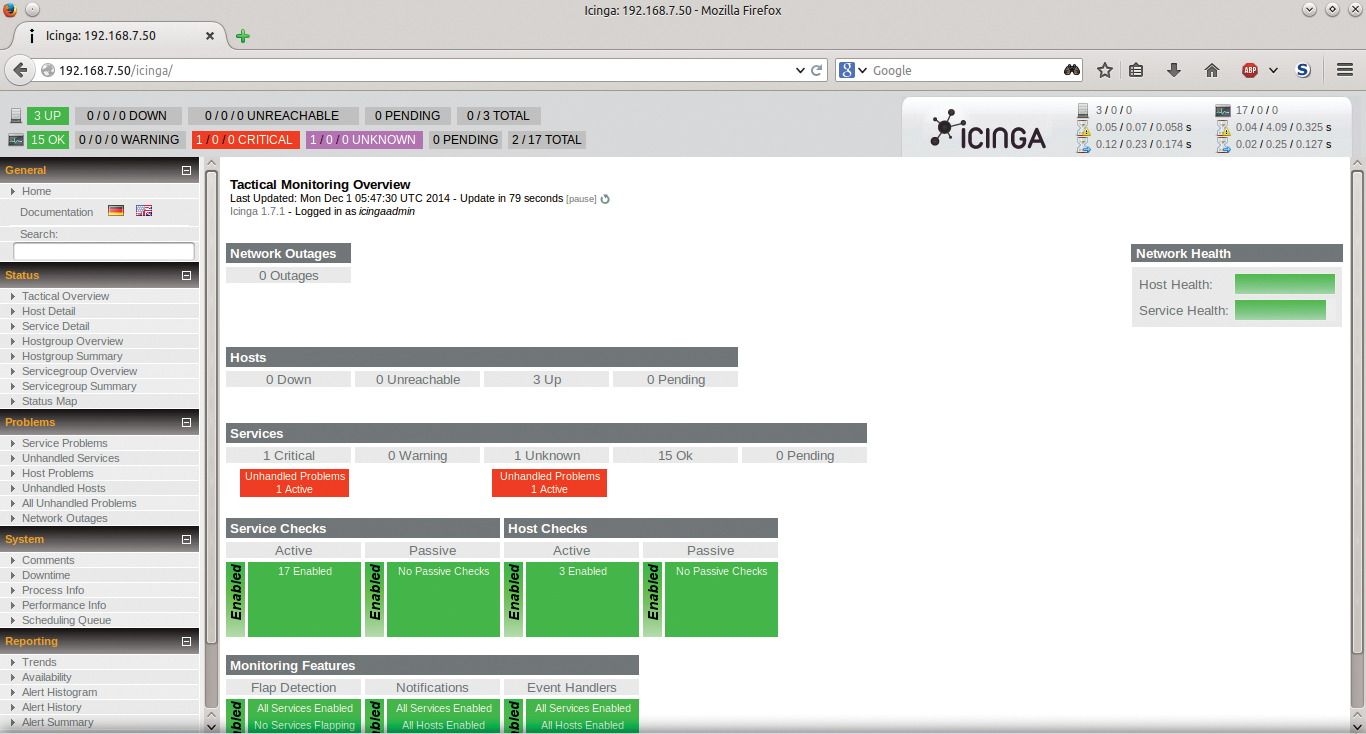
This tactical view gives you a view of the health of the hosts and services on your network and is an overarching view of your network status. I'll return to this interface later after a few nodes have been added to the configuration.
Configuring Icinga
Out of the box, Icinga does not come configured other than to monitor the node on which it is installed. However, before jumping directly into an explanation of configuration, I will explore the application and its options. All configuration is accomplished via the command line [12]. Like any other Linux/Unix application, Icinga configuration is accomplished via text-based files [13]. Icinga configuration files have .cfg extensions, and they're centrally located in /etc/icinga.
The main configuration file is icinga.cfg [14]. Icinga configuration comprises two main types: resource files and object files.
- Resource files. The
resource.cfgfile contains user-defined macros that store usernames, passwords, and other items used in command definitions. - Object configuration files. These files are set in the
icinga.cfgfile, and the object definitions are found in/etc/icinga/objects/. Objects are defined in simple text files that describe the nodes to be monitored, relevant services, contact information, and even alert modes. All of these objects together define the network monitoring setup.
Several third-party open source projects provide an add-on web interface for configuring Icinga. If that is your need, both NConf [15] and NagiosQL [16] are easy to install and feature rich options.
Notifications
A powerful feature of network monitoring is its ability to inform you when your infrastructure is having issues. Such notifications can be sent via email, pager, Jabber, and other methods.
To enable email notifications, edit the /etc/incinga/objects/contacts.cfg file, find the line that begins with email, and replace icinga@localhost with your email address:
email <myemail>@<mydomain>.com
By default, notifications in Icinga are not enabled. To do this, you can edit /etc/icinga/objects/localhost.cfg and comment out any notification instances as follows:
#notifications_enabled 0
Now that you understand some of the basics of Icinga, it's time to dive into monitoring servers, services, and networking devices.
Monitoring a Linux Server
Routinely, I have half a dozen running systems in my lab at once, and I often keep an eye on uptime and system availability. Monitoring a Linux server via Icinga can be done with the use of two plugins: the check_by_ssh plugin or NRPE.
The check_by_ssh plugin, as its name indicates, uses SSH to monitor nodes. The NRPE tool allows plugins to execute on a remote host, so you can monitor disk usage, CPU load, memory, and so on.
For this article, I will use NRPE. The first step is to configure the additional Linux server to be monitored (named ubuntusrv) by installing NRPE on that server. You can do this with the following command:
sudo apt-get install nagios-nrpe-server
Next, you need to configure NRPE by editing the config file nrpe.conf:
nano /etc/nagios/nrpe.cfg
Under allowed hosts, add the IP address or CIDR notation network that you want to access NRPE:
allowed_hosts=127.0.0.1, 192.168.7.50
dont_blame_nrpe=1
Save your changes and then restart the NRPE server:
service nagios-nrpe-server restart
Now, on the Raspberry Pi, you will need to install the nagios-nrpe-plugin package. You can do that using the following command:
apt-get --no-install-recommends install nagios-nrpe-plugin
Next, you should check whether you can connect to NRPE on the client from the Pi:
sweetpi@raspberrypi ~ $ /usr/lib/nagios/plugins/check_nrpe-H 192.168.7.51
NRPE v2.15
If you see NRPE v2.15 in the output, it's good to go.
Next, on the Raspberry Pi Icinga server, you will need to create a new configuration file for the Linux server that is to be monitored using:
sudo nano ubuntusrv_icinga.cfg
Then, add the text in Listing 1 to the newly created configuration file. Next, you can restart Icinga:
Listing 1: Linux Server Configuration File
01 define host{
02        use generic-host
03        host_name ubuntusrv
04        alias server2
05        address 192.168.7.51
06 }
07 define service{
08        use generic-service
09        host_name ubuntusrv
10        service_description PING
11        check_command check_ping!100.0,20%!500.0,60%
12 }
13 define service{
14        use                           generic-service         ; Name of service template to use
15        host_name                     ubuntusrv
16        service_description           Disk Space
17        check_command                 check_nrpe!check_disks!20%!10%
18 }
19 define service{
20        use                           generic-service
21        host_name                     ubuntusrv
22        service_description           Current Users
23        check_command                 check_nrpe!check_users!20!50
24 }
25
26 define service{
27         use                          generic-service         ; Name of service template to use
28         host_name                    ubuntusrv
29         service_description          Current Load
30         check_command                check_nrpe!check_load!5.0!4.0!3.0!10.0!6.0!4.0
31 }
32 define service{
33        use                           generic-service         ; Name of service template to use
34        host_name                     ubuntusrv
35        service_description           SMTP
36        check_command                 check_smtp
37 }
38 define service{
39        use                           generic-service         ; Name of service template to use
40        host_name                     ubuntusrv
41        service_description           HTTP
42        check_command                 check_http
43 }
sudo service icinga restart
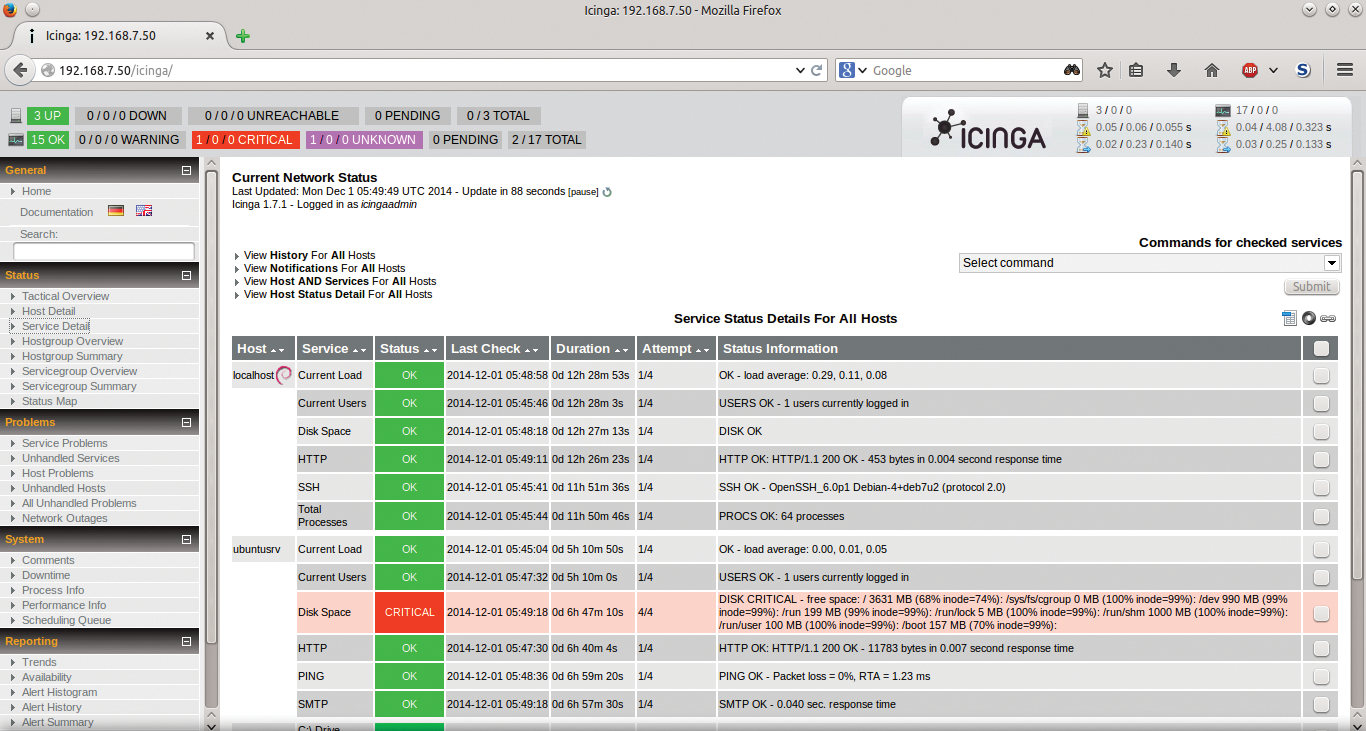
Now that you are monitoring your key Linux server with Icinga (Figure 4), you also should set up monitoring for another example device – a Windows server.
Monitoring Microsoft Windows 2012
Most of the world of computing is heterogeneous. Rarely does a network comprise a single OS or technology. Thankfully, open source does an outstanding job of supporting just such a reality. Icinga is no exception. Out of the box, it supports industry standards and technologies. With Icinga, you can monitor Windows servers through a client called NSClient++ [17], so the first step is to install an NSClient++ [18] on, for example, a Microsoft Windows 2012 server – with lots of pointing and clicking.
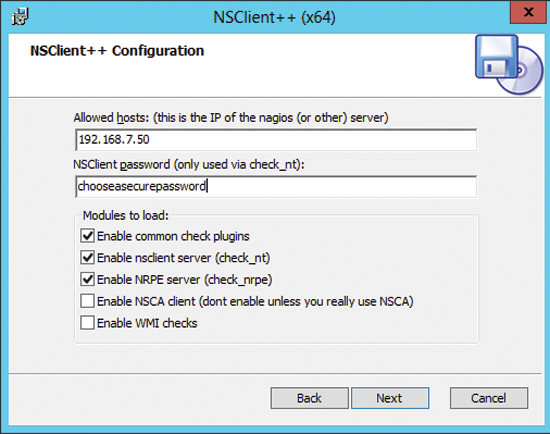
After starting the NSClient++ Setup Wizard, fill out the configuration as in Figure 5. Remember to open TCP port 12489 for NSClient on the Windows firewall. Also, its a good idea to block this port explicitly in your network firewall.
Now that you have the client (called w2k12srv) you are going to monitor installed on the server, you need to return to your Raspberry Pi and create a new host definition and detail its related services. To do so, create another configuration file,
sudo nano w2k12srv_icinga.cfg
to which you add the configuration shown in Listing 2. Finally, you should edit resources.cfg and add the password you specified when installing NSClient++ on your Windows server:
Listing 2: Windows Server Configuration File
01 define host{
02 use         windows-server      ; Inherit default values from a template
03 host_name   w2k12srv            ; The name we're giving to this host
04 alias       Windows Server 2012 ; A longer name associated with the host
05 address     192.168.7.52        ; IP address of the host
06         }
07 define service{
08 use                     generic-service
09 host_name               w2k12srv
10 service_description     Uptime
11 check_command       check_nt!UPTIME
12         }
13 define service{
14 use                     generic-service
15 host_name               w2k12srv
16 service_description     CPU Load
17 check_command       check_nt!CPULOAD!-l 5,80,90
18         }
19 define service{
20 use                     generic-service
21 host_name               w2k12srv
22 service_description     Memory Usage
23 check_command       check_nt!MEMUSE!-w 80 -c 90
24         }
25 define service{
26 use                     generic-service
27 host_name               w2k12srv
28 service_description     C:\ Drive Space
29 check_command       check_nt!USEDDISKSPACE!-l c -w 80 -c 90
30         }
31 define service{
32 use                     generic-service  ; Inherit default values from a template
33 host_name               w2k12srv
34 service_description     HTTP
35 check_command       check_http
36         }
$USER9$=averysecretpassword
Next, you have to make a small change to your /etc/nagios-plugins/config/nt.cfg file by changing the first three lines in the section that begins # 'check_nt' command definition to the lines shown in Listing 3.
Listing 3: Plugins Configuration File
01 # 'check_nt' command definition
02 define command {
03         command_name    check_nt
04         command_line    $USER1$/check_nt -H $HOSTADDRESS$ -p 12489 -s $USER9$ -v $ARG1$ $ARG2$
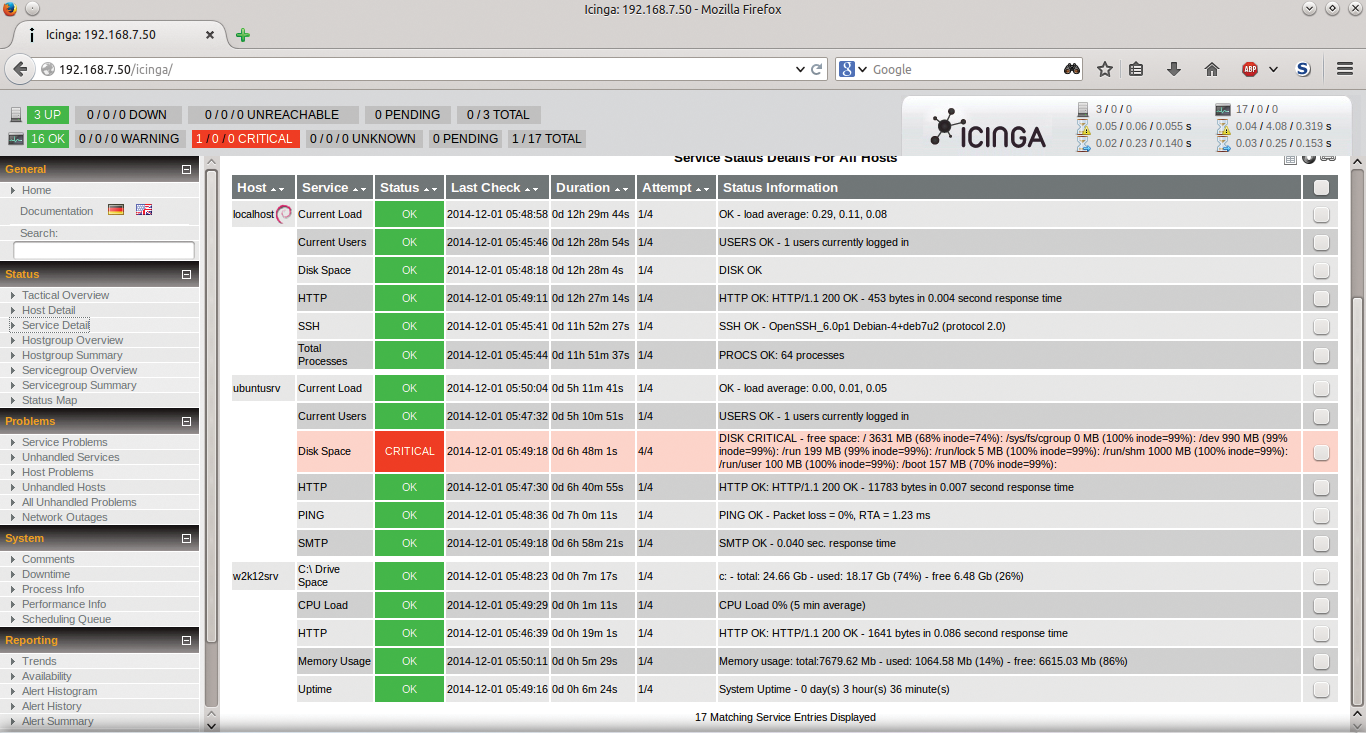
Now when you return to the Icinga web interface, your three nodes are up and running, with one service giving an error (Figure 6). Icinga is doing its job swimmingly. However, something is down. No worries, because this is a virtual test machine and not a mission-critical machine or service.
I hope this short exploration of Icinga on Raspberry Pi has been elucidating and fun. You have built a simple, inexpensive, feature-rich network monitor with the power of open technology. You really have no need to pay a bundle for a SaaS monitoring solution or big bulky server; you can build it yourself. My hope is that you will do more exploring [19] and find new and exciting uses for both Raspberry Pi and Icinga. Happy monitoring!
