Retrieving Windows performance data in PowerShell
Taking Precautions
Basic performance data and health status of Windows computers can be collected and evaluated very easily and conveniently using PowerShell. The scripting language is an ideal candidate both for local and remote machines because it is familiar with a variety of interfaces in different Windows subsystems.
The number of interfaces and connection points increases steadily with each new version of a Microsoft product. For example, Windows performance, process, registry, and network information is easily understood using Windows Management Instrumentation (WMI). Data from Windows server roles and from the operating system's advanced configuration do not pose any obstacles, either.
In this article, I show you how to use PowerShell to access WMI and performance data on local or remote computers, how to find relevant WMI objects, and how to look at the performance of individual computers and check for violations of threshold values. The scripts shown here are intended for Windows installations starting from Windows 7 and Windows Server 2008 R2.
Collecting WMI Object Data
Much of the information available via a computer can be accessed or controlled as objects automatically via the WMI interface. The interface publishes information about the computer, the operating system, and objects, which can be queried in the form of classes and attributes. WMI also can control your computer remotely. Some classes implement methods that can be used to shut down the computer or configure operating system components.
WMI is a good candidate for a general inventory of machine properties because of the extensive amount of data provided. Of course, PowerShell provides the necessary tool to collect the data. To access WMI objects, you use the Get-WMIObject cmdlet with the WMI object to be queried as a parameter (Listing 1).
Listing 1: Get-WMIObject Cmdlet
# Get-WMIObject Win32_OperatingSystem
SystemDirectory: C:\Windows\system32
Organization:
BuildNumber:     9600
RegisteredUser:  johndoe@outlook.com
SerialNumber:    00282-30340-00000-AB9A5
Version:         6.3.9600
The information you read from the operating system can also be formatted and customized. For example, normally only the operating system's most important attributes are displayed. If you want to discover its Name attribute, you can explicitly request it using PowerShell (Listing 2).
Listing 2: Getting the Operating System Name
# Get-WMIObject Win32_OperatingSystem | fl Name, BuildNumber, Version
Name:        Microsoft Windows 8.1 Enterprise|C:\Windows|\Device\Harddisk0\Partition4
BuildNumber: 9600
Version:     6.3.9600
The command return value also can be saved in a variable that can be used to address individual attributes specifically, such as the Name and the Caption attribute (Listing 3). The requests issued to WMI previously all ran on the local computer. However, WMI is network-capable, meaning you can also send WMI requests to remote computers. The prerequisite, of course, is that you have the necessary permissions. The ComputerName parameter takes the name of the remote computer (Listing 4).
Listing 3: Saving the Command Return Value
# $os = Get-WMIObject Win32_OperatingSystem
# $os.Name
Microsoft Windows 8.1 Enterprise|C:\Windows|\Device\Harddisk0\Partition4
# $os.Caption
Microsoft Windows 8.1 Enterprise
Listing 4: Sending WMI Request to Remote Computer
# Get-WMIObject Win32_OperatingSystem -ComputerName web-2008R2 | fl Name, BuildNumber, Version
Name:        Microsoft Windows Server 2008 R2 Standard|C:\Windows|\Device\Harddisk0\Partition2
BuildNumber: 7601
Version:     6.1.7601
If you need to specify different logon information because the target computer is not in the same domain or is not a standalone computer, the Credential parameter can get the username and password. The smartest way to do this is to retrieve the logon information in a password mask and use it as a secure character string (Listing 5).
Listing 5: Getting Logon Information
# $c = Get-Credential
# Get-WMIObject Win32_OperatingSystem -ComputerName web-2008R2 -Credential $c | fl Name, BuildNumber, Version
Name:         Microsoft Windows Server 2008 R2 Standard|C:\Windows|\Device\Harddisk0\Partition2
BuildNumber : 7601
Version:      6.1.7601
For those of you who don't like typing, the cmdlet has an alias – a short form – designed to take some typing out of the rather long cmdlet command line: Instead of Get-WMIObject, you can write gwmi.
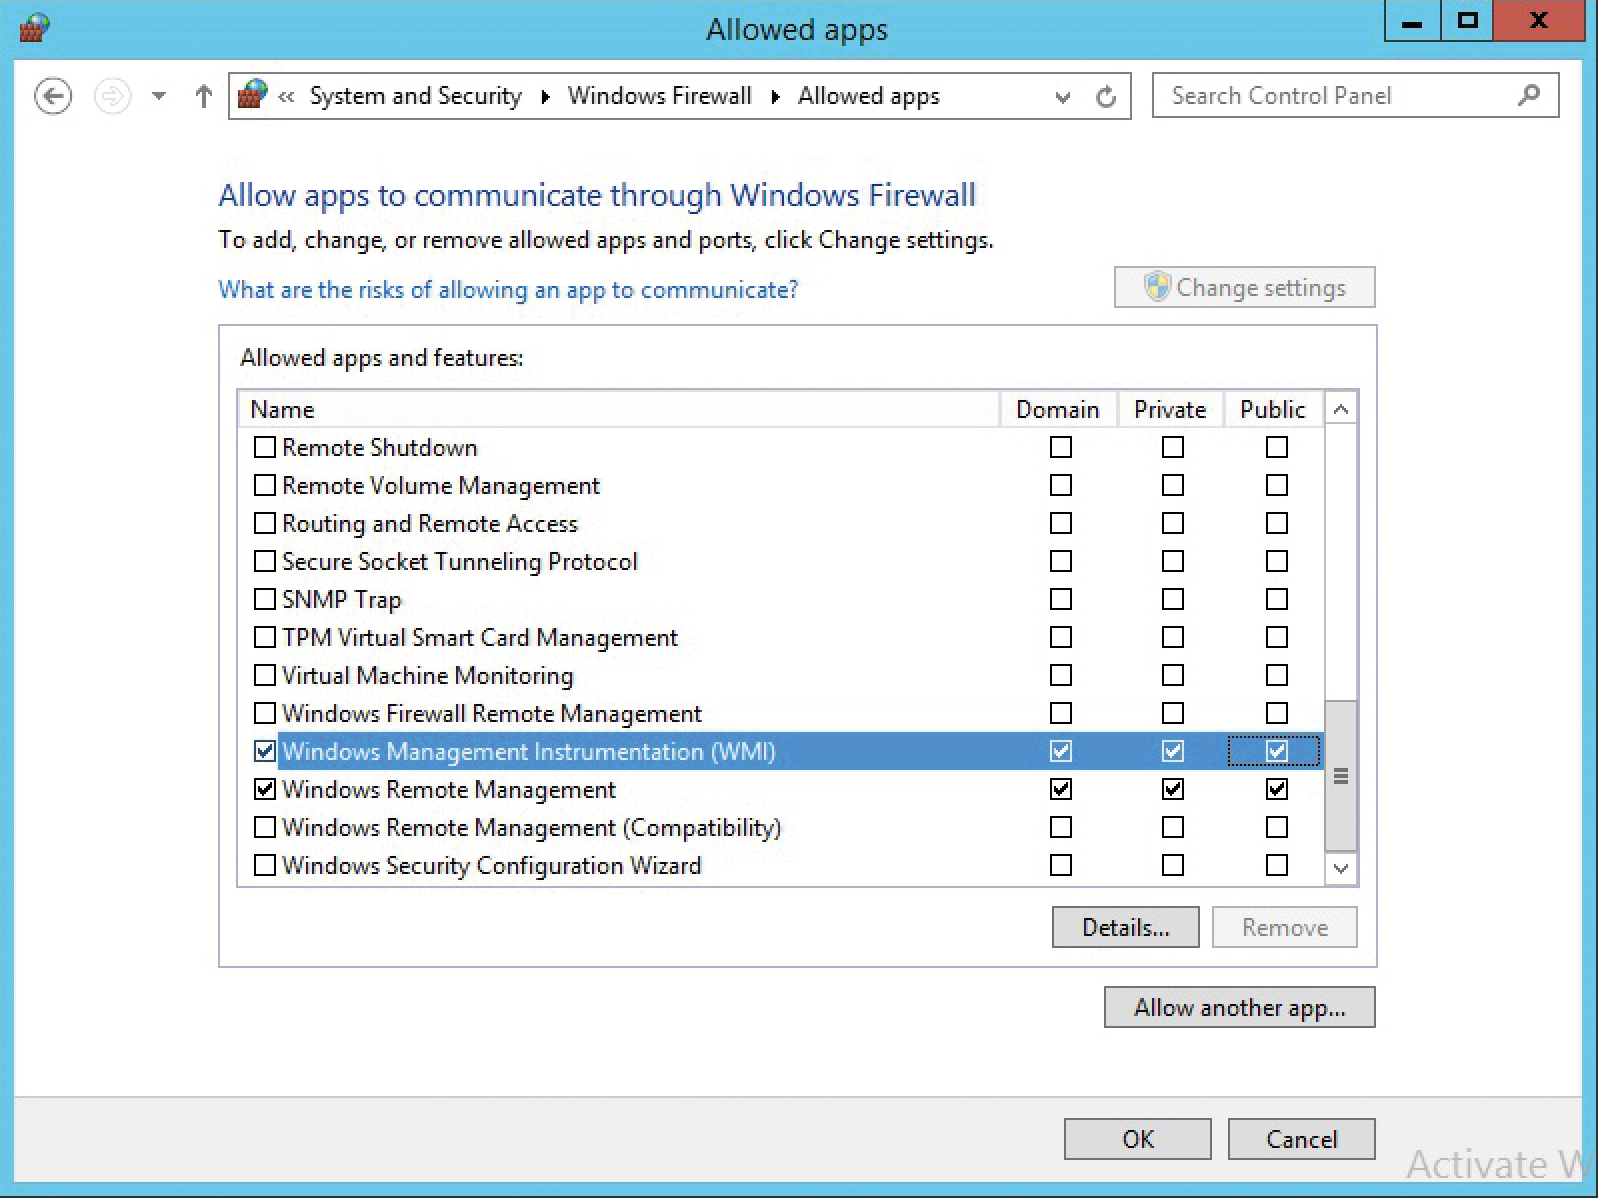
Failing to set up the WMI configuration on Windows Firewall is a well-known pitfall when querying WMI on remote computers. WMI must be configured for remote queries before the data can be retrieved. If this is not the case, the cmdlet fails and displays the error message RPC server unavailable. A new firewall rule that allows Windows Management Instrumentation (WMI) (Figure 1) provides a remedy. You can enable this firewall exception either manually on the target computers or through Group Policy.

Finding Relevant WMI Objects
The WMI subsystem in Windows provides information about all hardware and software in more than 600 classes, each with several attributes. Murphy's law thus dictates that you will quickly lose track of, or not be able to find, the right class.
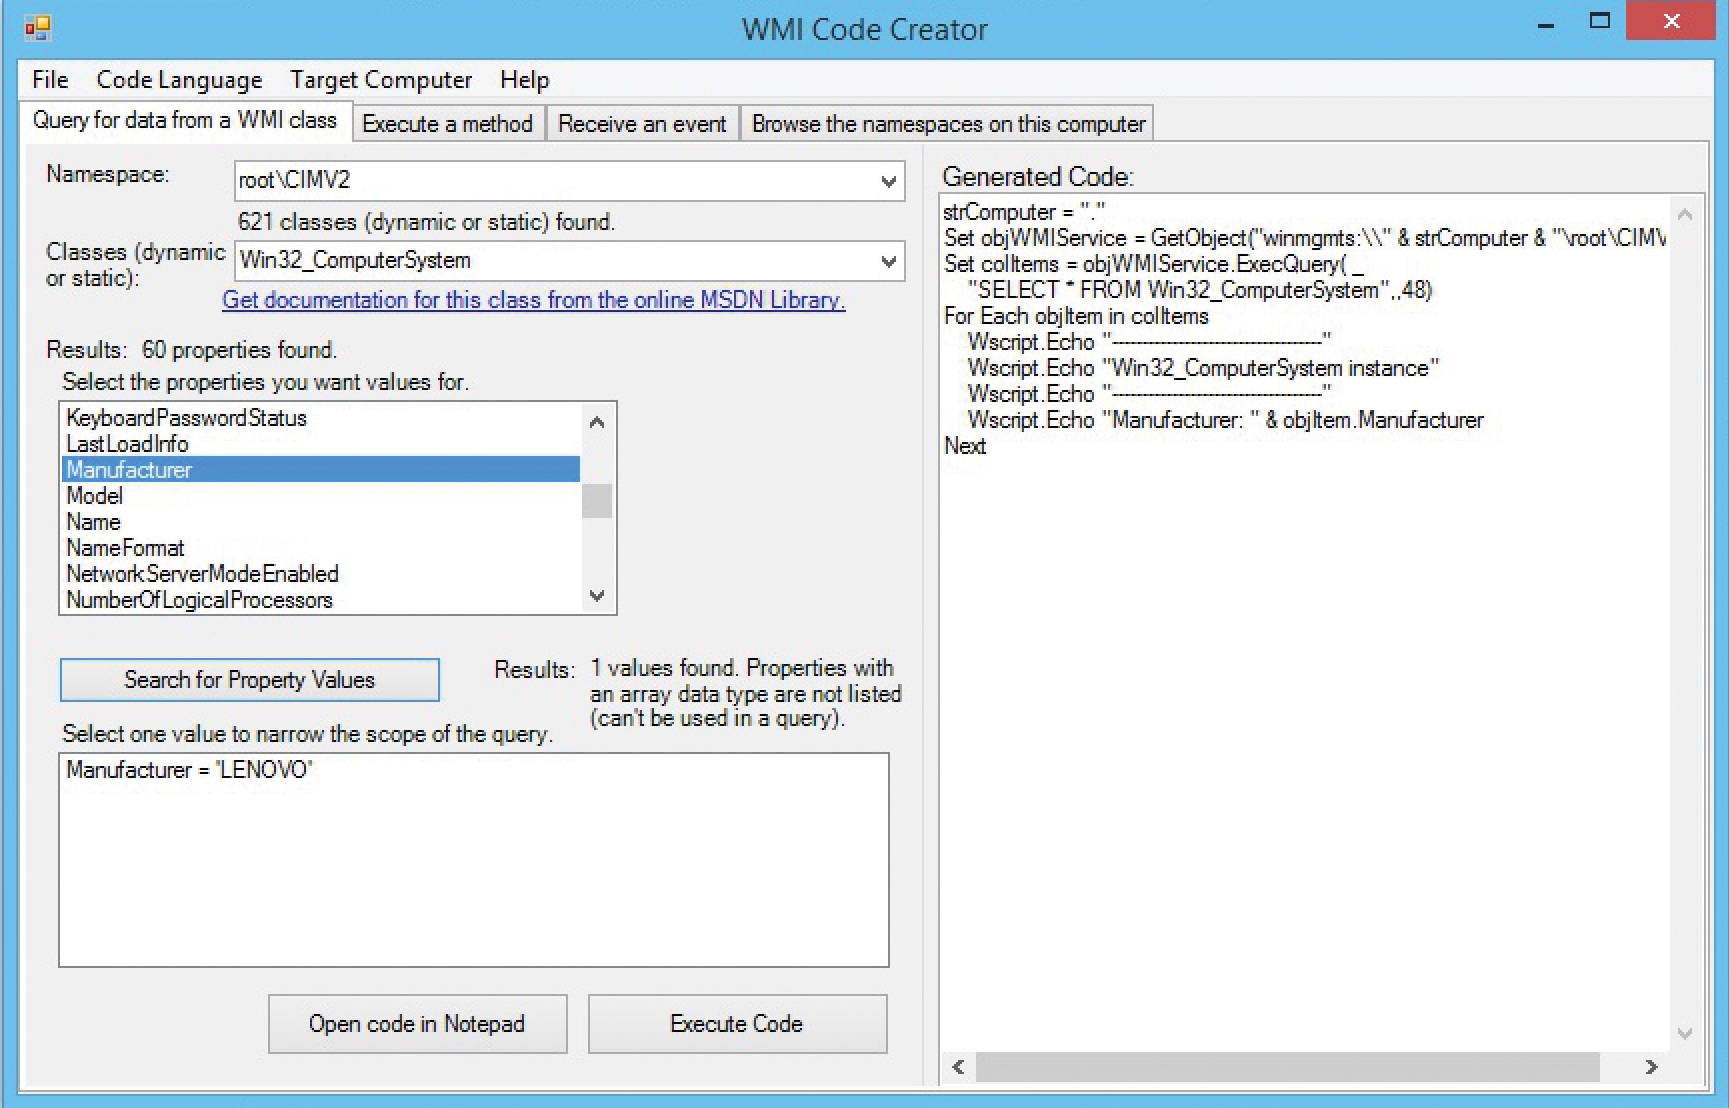
The Microsoft Developer Network [1] is a good place to start. WMI Code Creator [2], a program that Microsoft provides for free, offers further clues as to the available classes and their attributes. The software, which was actually designed for programmers, randomly generates sample code for WMI in the languages C#, Visual Basic, .NET, and Visual Basic Scripting (VBS).
With the drop-down menu, you can create program snippets. It lists all available classes in a pick list sorted by name. If you select a class, the available attributes are displayed (Figure 2). What's more, if you find an interesting attribute, a script can be run on the local computer at the push of a button to display the value of the attribute for the local computer.For example, you can see whether the class found with the attribute combination is correct and whether the attribute contains the correct value in the desired format. Table 1 lists a selection of important WMI classes.

Tabelle 1: Important WMI Classes
|
WMI Class |
Description |
|---|---|
|
|
Computer system information, such as name, hardware type, start mode, status of the domain accession. |
|
|
Information about the hard disks and their sizes. |
|
|
Overview of environment variables. |
|
|
Information about data on the filesystem; file information (e.g., size, version number). |
|
|
Information on local groups and group members. |
|
|
Overview of the logical drives and partitions. |
|
|
Active Directory domain or workgroup information. |
|
|
CAS proxy information about the Windows operating system (e.g., name, version, service packs, owners). |
|
|
Information about network cards. |
|
|
Software repository and installed applications information. |
|
|
Query local user accounts. |
|
|
Find volume data. |
Assembling Complex Queries
The selection in Table 1 provides valuable information about individual data from target computers. Automatic querying of these items is demonstrated in a small script named get-serverinfos.ps1 (Listing 6).
Listing 6: get-serverinfos.ps1
01 ##Load server list. A text file containing one server name per line.
02 $serverList = Get-Content -Path C:\temp\server.txt
03 $logfile = "C:\temp\logfile.txt"
04 Add-Content $logfile -value "..................................................."
05 Add-Content $logfile -value "New log file $(Get-Date)"
06 $c = Get-Credential
07 ##A loop that is run for each server foreach ($server in $serverList)
08 {
09     ##check whether the server answer via ping.
10     if (Test-Connection -ComputerName $server -Quiet -Count 1)
11     {
12     ##If the server can be reached via ping, then:
13       Add-Content $logfile -value "...Server $($server)..."
14       $computerInfo = Get-WMIObject Win32_ComputerSystem \
           -computerName $server -Credential $c
15       $osInfo = Get-WMIObject Win32_OperatingSystem -computername \
           $server -Credential $c
16       $bootTime = [string]$osInfo.ConvertToDateTime ($osInfo.LastBootUpTime)
17       #If the manufacturer is Microsoft or VMWare
18       if($computerInfo.Manufacturer -eq "Microsoft Corporation" \
            -and $computerInfo.Model -eq "Virtual Machine")
19       {
20         $type = "Hyper-V Virtual Machine"
21       }
22       elseif($computerInfo.Manufacturer -eq "VMware, Inc." \
                -and $computerInfo.Model -eq "VMware Virtual Platform")
23       {
24         $type = "VMWare Virtual Machine"
25       }
26       else
27       {
28         $type = "physical machine"
29       }
30       ##Computer Info
31       Add-Content $logfile -value "Member of $($computerInfo.Domain). \
           Made by $($computerInfo.Manufacturer)."
32       Add-Content $logfile -value "It is a $($type)."
33       Add-Content $logfile -value "RAM: $\
          ($computer Info.TotalPhysicalMemory/1024/1024) MByte"
34       ##OSInfo
35       Add-Content $logfile -value "Running on $($osInfo.Caption), \
           build $($osInfo.BuildNumber) - with $($osInfo.OSArchitecture)"
36       Add-Content $logfile -value \
          "Installed on $($osInfo.ConvertToDateTime($osInfo.Install Date))"
37       Add-Content $logfile -value \
          "Registered user: $($osInfo.RegisteredUser)"
38      Add-Content $logfile -value "Last started $($bootTime)"
39     }
40     else
41    {
42       Write host "The server $($server) cannot be reached. \
           We proceed with the next..."
43    }
44 }
The sample script reads server names from a text file and tries to ping the server online. The server names are stored one per line in the server.txt file. If the server responds to the ping, the data is collected using previously retrieved logon information. The formatted information is then written to a second text file named logs.txt. Of course, you can change the file names at the beginning of the script file.
Another distinction is made between physical and virtual machines. If the manufacturer is Microsoft or VMware and the model is Virtual Machine or VMware Virtual Platform, the target can hardly be physical hardware. The script implements the case distinction and outputs the knowledge it gleans. A distinction is made between virtual machines on Hyper-V or VMware and physical hardware. The script can be extended easily for additional hypervisors.
Other data from the WMI repository can be queried, depending on whether Java is installed on the computer. The class to use is Win32_Product (Listing 7). To narrow down the selection of objects, you can use a filter with the Get-WMIObject cmdlet. Up to know, all the available results that have been output have been re-used in PowerShell. However, that is not entirely useful for a search against all possible software packages; the result list from Win32_Product is usually very long because target computers typically have a large quantity of installed software.
Listing 7: Win32_Product
# Get-WMIObject Win32_Product -Filter "Vendor like 'Oracle%'"
IdentifyingNumber: {26A24AE4-039D-4CA4-87B4-2F83217051FF}
Name:              Java 7 Update 51
Vendor:            Oracle
Version:           7.0.510
Caption:           Java 7 Update 51
If the WMI interface can perform the necessary filtering, you can save time by searching and processing the results list within PowerShell. Both variants – filtering via WMI or filtering in PowerShell – are target oriented. You need to add two lines of code to the existing script to embed the Java query. The lines would look like this:
# $java = get-wmiobject Win32_Product -Filter "Vendor like 'Oracle%'"
# if($java -ne $null) { Add-Content $logfile -value "Java is installed." }
By looking at other attributes of repository software packages, you can create a small software inventory. Even the software version is available, which allows you to check whether individual computers are using obsolete programs. All packages installed with Windows Installer (MSI files) are in Win32_Product. It provides information about versions of Office or other business applications on personal computers or workstations.
Reading Performance Data
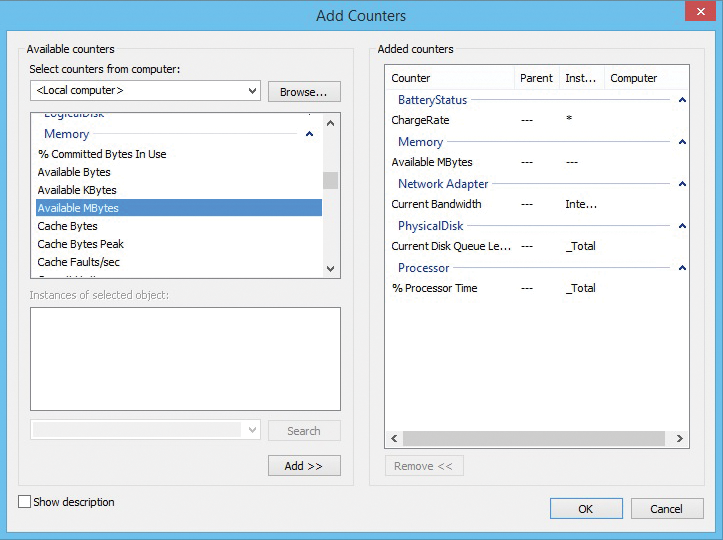
Performance testing only really becomes exciting if you can evaluate the performance data. Windows provides performance logging in the Performance Monitor. The subsystem lets you create individual snippets or longer historical records of the computer's performance. The system uses a variety of indicators that measure and log certain performance components. The known performance counters include CPU usage, free available memory, and the physical hard disk queue and its percent free space (Figure 3).

Anyone who is familiar with the details of performance logging in Windows can familiarize themselves with the Performance Monitor. To access it via the console, type perfmon.msc. You can enable more performance indicators as needed; they are divided into several categories such as Processor, Memory, or PhysicalDisk. Indicators are freely selectable. After the indicators have been selected, the Performance Monitor displays the collected data as plots on a chart.
All the performance counters found in the Performance Monitor can be queried and reused with PowerShell. If you know the names of the counters, you can query them using the Get-Counter cmdlet (Listing 8).
Listing 8: Getting a Single Get-Counter Value
# Get-Counter -Counter "\Processor(_Total)\% Processor Time"
Timestamp                   CounterSamples
---------                   --------------
16.03.2014 10:58:22         \\helix\processor(_total)\% \
  processor time: 24.4764593867485
Querying an indicator once will output the current real-time value for the system. However, because it is only a single value that might be taken when the system is briefly peaking or in a trough, it might have very little validity in terms of the true state of the system. To collect multiple values then, the cmdlet supports two parameters: MaxSamples and SampleInterval.
The cmdlet in Listing 9 does not just retrieve the current value, it picks up a total of 10 samples at five-second intervals, or a period of 50 seconds, which you can then reprocess using, for example, Measure-Object to determine the mean value:
Listing 9: Collecting Multiple System Values
# Get-Counter -Counter "\Processor(_Total)\% Processor Time" \
  -SampleInterval 5 -MaxSamples 10
Timestamp                   CounterSamples
---------                   --------------
16.03.2014 11:17:13 AM      \\helix\processor(_total)\% \
  processor time: 18.6118692812167
                            16.03.2014 11:17:18 AM
                            \\helix\processor(_total)\% \
                              processor time: 24.2151756511614
                            16.03.2014 11:17:23 AM
                            \\helix\processor(_total)\% \
                              processor time: 23.8306694146364
[...]
# $samples = Get-Counter -Counter "\Processor(_Total)\% Processor Time" \
   -SampleInterval 5 -MaxSamples 10
# $samples.CounterSamples.CookedValue | Measure-Object -Average
Count:   10
Average: 9.04691386288023
Sum:
Maximum:
Minimum:
Property:
The collected raw data is embedded in CookedValue and sent through the pipe to Measure-Object, where it emerges as an average. This basic method can be compiled as a small script that collects performance counters, calculates the means, and then outputs the values.
You can expand the collect-counters.ps1 script (Listing 10) as you like. It collects the data for the selected performance counters and outputs them at the command line after retrieval. A neat progress indicator also appears. The performance counters are stored in an array that can be expanded arbitrarily. The three counters used are only examples. The script is created so that the array can be filled with a few more indicators, which are then automatically scanned one after another.
Listing 10: collect-counters.ps1
##Parameter
$NUMBER_OF_SAMPLES = 5;
$SAMPLE_INTERVAL_TIME = 1;
$counters = @(
"\Memory\Available MBytes",
"\Processor(_Total)\% Processor Time",
"\LogicalDisk(_Total)\% Free Space",
"\Network Adapter(NIC TEAM 1)\Bytes Total/sec",
"\Objects\Processes"
) ##enter other counter here.
##the values are saved here.
$val = @{}
$i = 0;
foreach($counter in $counters)
{
    Write-Progress -activity "Collecting performance data"
    -status "Counter data $($i+1) von $($counters.Count):
    $($counter)" -PercentComplete
    $(($i+1)/($counters.Count+1)*100)
    try
    {
      $v = Get-Counter -Counter $counter -MaxSamples
      $NUMBER_OF_SAMPLES -SampleInterval $SAMPLE_
      INTERVAL_TIME
      $val.Add($counter, ($v.CounterSamples.CookedValue
      | Measure-Object -Average).Average )
    }
    catch
    {
      Write-Host "Error: the counter could not be collected. Reason: $($_)"
    }
    $i++;
}
    Write-Progress -activity "Collecting performance data" status \
     "Releasing results" -PercentComplete 100
Write-Host "Results: "
$val
Reviewing Threshold Values
The script only outputs values at the command line, so there is no automatic warning if one of the performance counters reaches a critical value. To do so, the script in Listing 11 breaks the task down into three functions: one each to test for a shortfall or surfeit of the threshold value, and one to collect the data from remote servers.
Listing 11: warn-counters.ps1
##Parameter
$NUMBER_OF_SAMPLES = 5;
$SAMPLE_INTERVAL_TIME = 1;
###Load server list
$serverList = Get-Content -Path C:\temp\server.txt;
##Defining the counter and threshold values
##Each line: Counter, alarm triggers if over/under, threshold value
$counters = (
('\Memory\Available MBytes', 'under', 500), #Alert if under 500
('\Processor(_Total)\% Processor Time', 'over', 60), #Alert if over 60
('\LogicalDisk(_Total)\% Free Space', 'under', 10 ) #Alert if under 10
) #Array end
function checkLowerLimit([int]$threshold, [int]$average)
{
    if($average -lt $threshold)
   {
      Write-Host "threshold value not reached!" return $false;
    }
    return $true;
}
function checkUpperLimit([int]$threshold, [int]$average)
{
    if($average -gt $threshold)
    {
      Write-Host "threshold value exceeded!" return $false;
    }
    return $true;
}
function getPerformanceData([array]$counter, [string]$machine)
{
    try
    {
      $v = Get-Counter -Counter $counter -ComputerName $machine \
        -MaxSamples $NUMBER_OF_SAMPLES -SampleInterval
      $SAMPLE_INTERVAL_TIME -ErrorAction SilentlyContinue
      if($v -eq $null -or $v -eq "")
      {
        Write-Host "Counter $($counter) delivered no value."
        Continue;
      }
      $average = ($v.CounterSamples.CookedValue | \
        Measure-Object -Average).Average
    }
    catch
    {
      Write-Host "Error: the counter could not be collected. Reason: $($_)"
    }
    ##Bigger or smaller?
    if($counter[1] -eq "under") { $limit = checkLowerLimit \
                                  $counter[2] $average }
    else { $limit = checkUpperLimit $counter[2] $average }
    ##If the test retruns a "$false", the threshold value has been damaged:
    if(-not $limit) { Write-Host "[$($machine)] Counter \
      $($counter[0]) has, with the value $($average),
    exceed $($counter[2]) not reached $($counter[1]) \
      the threshold value." }
}
###The script starts here:
$c = $serverlist.Count * $counters.Count
$i=0;
foreach($server in $serverList)
{
    foreach($counter in $counters)
    {
      Write-Progress -activity "Collecting performance data" \
        -status "Counter data $($i+1) from $($c):
      $($counter) on $($server)" -PercentComplete $(($i+1)/($c)*100)
      getPerformanceData $counter $server
      $i++;
    }
} #End foreach server
    Write-Host "End of the collection. Threshold limit damages \
      are issued on the command line."
The collection script on remote computers is the well-known server.txt from the first example. The performance counters to be retrieved are in a table (array); each row represents a counter, and the columns represent the name, the check for a shortfall (under) or excess (over), and the threshold value itself. For example,
('\Memory\Available MBytes', 'under', 500)
checks to see whether the available memory drops below 500MB.
The script then runs through the freely extensible performance counters by server and checks the results. If a threshold is over- or undershot, it outputs a corresponding message on the command line. The server name is transmitted once again with the ComputerName parameter.
An extension of the script could dump the results to a text file or even a database, allowing you to evaluate a trend over time. PowerShell professionals could also parallelize the counter queries from several servers to save processing time.
Conclusions
PowerShell quickly and simply lets you keep an eye on the performance parameters of multiple computers from the command line. More complex scripts can be compiled to monitor threshold values.
