NetFlow reporting with Google Analytics
Traffic Analysis
Cisco IOS NetFlow [1] collects IP traffic statistics at network interfaces, providing a valuable source of information to system administrators who want to gain in-depth insights into the activities of their enterprise network. Routers and Layer 3 switches that support NetFlow collect client connection information and send it to a central server at irregular intervals. Since the introduction of NetFlow by Cisco, other major network hardware vendors have followed suit and implemented proprietary versions or the RFC-based version [2]. The basic principle is the same.
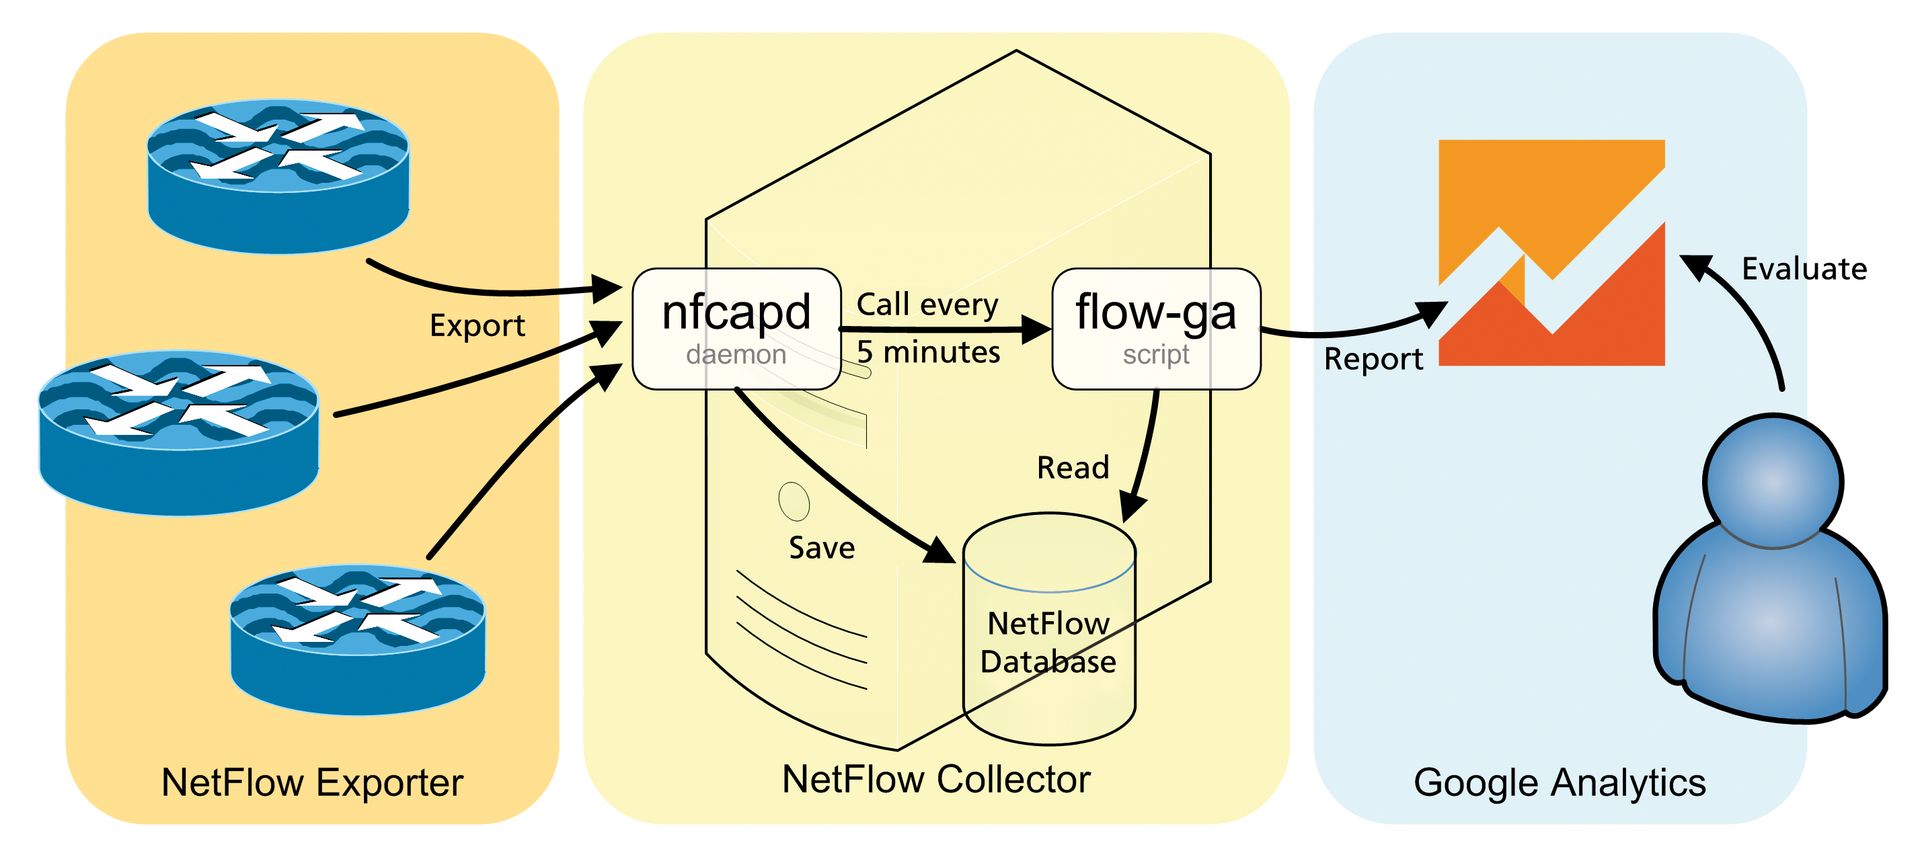
When using NetFlow in a professional environment, you are given the choice between a commercial NetFlow analyzer with many features or an open source implementation at zero cost. In this article, I describe a new, third variant: analysis of traffic data from the cloud. A NetFlow collector local to the company collects all the information and sends it (or just random samples) to Google Analytics for further storage and evaluation (see the "Google Analytics" box).
Google Analytics offers many approaches to visualizing the flood of information clearly in the form of dashboards and custom reports. In addition to the usual hit lists of the most frequented servers, it can display or discover unwanted protocols (e.g., SIP, OpenVPN, POP3) and tell you which client generates the most Internet traffic. Questions like "Which Windows file servers are being used, and which machines offer unauthorized shares?" or "Which client is accessing the firewall's management interface?" can also be answered with the available reports (see the "Tolerance by Google" box).
Providing Information
Routers, multilayer switches, firewalls, and virtual environments (hypervisor, vSwitch) supply information about IP connections, and all major manufacturers provide a way to export this information. Protocols such as NetFlow (Cisco), J-Flow (Juniper), or the standardized variants sFlow and IPFIX are also available.
Existing routers usually provide NetFlow functionality without additional costs, and the configuration is very simple. Preference is given to routers with NetFlow that are located close to the collector and have capacity to spare. When selecting the interfaces, you must ensure that network traffic is not counted twice (incoming for router A and outgoing for router B). The device configuration typically already supports initial filtering, so that uninteresting or safety-critical traffic data are ignored.
NetFlow offerings are thin on the ground in the SOHO area, but with a little luck, you might have a router with DD-WRT or pfSense. Unfortunately, the popular DSL routers from AVM do not support NetFlow.
What happens if your own routers do not offer a flow export? In this case, you can use a workaround in which a Linux computer receives a copy of all network packets via a mirror port and creates a NetFlow export from it. Suitable open source software for this includes, for example, the iptables module ipt_netflow or the pmacct and softflowd programs.
Collecting Traffic Data
As soon as the first router is configured as a NetFlow exporter, it sends information about terminated (or timed out) connections to the specified IP address at irregular intervals. The NetFlow collector, which is a Linux service that listens on UDP port 2055, resides behind this IP address. The connection information (see the "NetFlow" box) is taken from the received NetFlow samples and stored briefly on the local hard disk.
The open source nfdump [5] tool does this job on an existing Linux server or on a lean virtual machine (VM). A CPU core, 256MB of RAM, and a 2GB hard drive are sufficient for the VM. You can install on CentOS, Fedora, or Red Hat systems with the Yum package manager. The nfdump package is available from the EPEL repository:
$ yum install nfdump
Before starting, expand the local firewall to include a rule for incoming packages on port 2055 (SELinux requires no adjustment):
$ iptables -I INPUT -p udp -m state \
               --state NEW -m udp \
               --dport 2055 -j ACCEPT
$ ipt6ables -I INPUT -p udp -m state
            --state NEW -m udp \
            --dport 2055 -j ACCEPT
The collector is launched using
$ nfcapd -E -T all -p 2055 -l /tmp -I any
to test the installation. The first NetFlow data should be visible in the Linux console after a short time. (See the "NetFlow Configuration" box.)
Preparing Google Analytics
You must have a Google account, which you can upgrade to include the Analytics service so you can use Google Analytics (GA) [6]. Cautious users might want to check the GA conditions against their own company policy beforehand. Next, create an account and a property within GA. Google then announces the tracking ID (e.g., UA-12345678-1). This is entered in the script flow-ga.pl (see next section) and connects the reported NetFlow data with the Google account.
The property still needs custom definitions that represent the field names of NetFlow and are applied manually. The order and spelling is important. The definitions are associated with the Hit scope (as opposed to the Product, Session, or User scopes). These include custom dimensions:
1. srcaddr
2. dstaddr
3. srcport
4. dstport
5. protocol
6. exporter_id
7. input_if
8. output_if
9. tos
and custom metrics:
1. bytes (integer)
2. packets (integer)
3. duration_sec (time)
4. duration_msec (integer)
Reporting NetFlow Entries
Unfortunately, Google Analytics is not familiar with either NetFlow or most of the NetFlow variables (e.g., port number or IP protocol), as opposed to the usual GA categories (e.g., Page views, Events, E-Commerce, Timing). The art therefore lies in correct mapping. The Events section has proven to be very advantageous and flexible in the context of custom dimensions and metrics. These sections offer enough scope to capture all of your NetFlow information.
Conversion from the NetFlow format to the Google Analytics Measurement Protocol [7] and the subsequent production of reports are handled by my flow-ga tool [8], which is called by the NetFlow collector nfcapd at five-minute intervals (Figure 1). After downloading the tool, you should store the files in /usr/bin/. Any additional Perl modules that you need can be installed using the package manager:
$ yum install perl-Time-HiRes \
      perl-Digest-HMAC perl-DateTime \
      perl-libwww-perl

As usual on Linux, Syslog handles the logging:
$ echo "local5.* /var/log/flow-ga.log" > \
      /etc/rsyslog.conf
$ service rsyslog restart
It is a good idea to take a look at the functions _anonymizeIp() and get_hostname() from flow-ga.pl before starting. You will want to enable anonymization so as not to divulge too many details about the network. Simple anonymization, which inverts the IP address' second octet and makes the host name unrecognizable, is set up by default.
Finally, entering
$ nfcapd -D -w 5 -T all -p 2055 -l /tmp \
             -I any -P /var/run/nfcapd.pid \
             -x "/usr/bin/flow-ga.sh %d/%f"
starts the NetFlow collector as a daemon.
Evaluating Acquired Data
As soon as the first entries arrive in GA, the Real-Time dashboard becomes more colorful and interesting. Collecting IP addresses is useful for a quick top 10 overview. Google only provides the data for professional reports, which provide users with additional insight into its network after 24 hours.
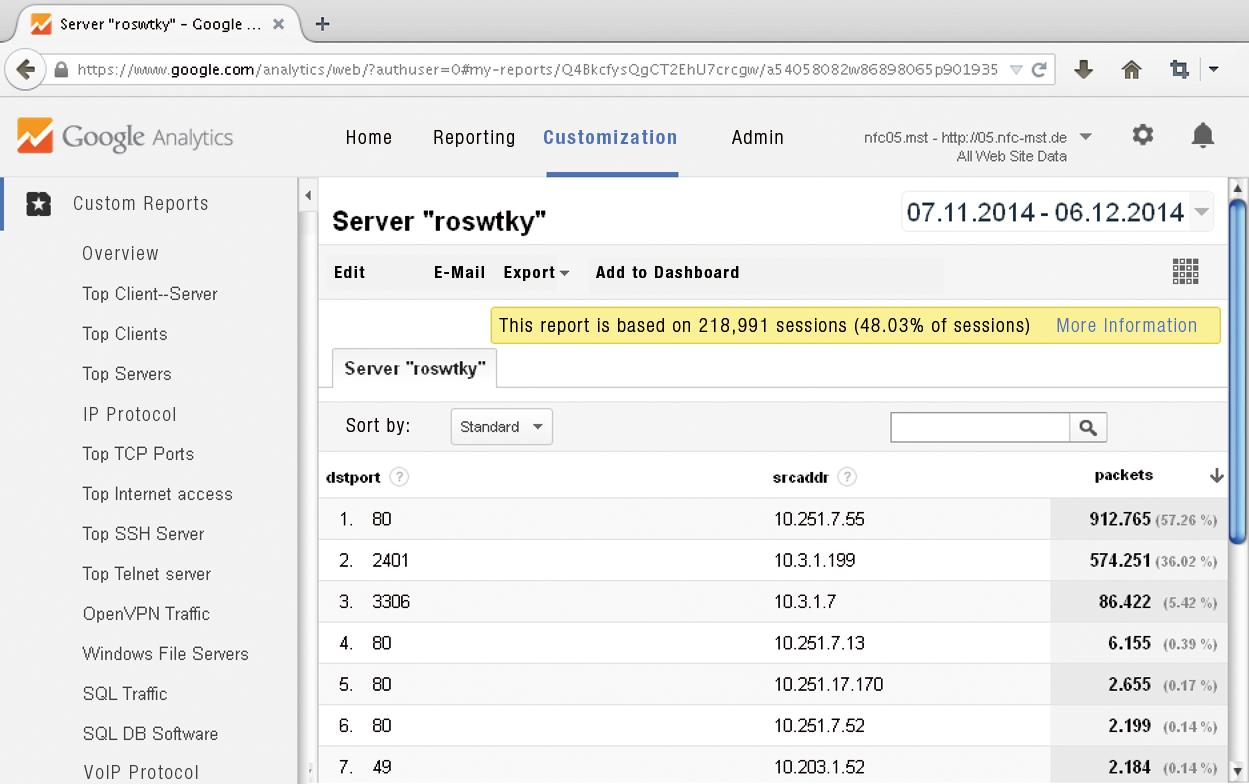
Values in the Behavior/Results fields are available after a few days. Here you can sort by IP addresses, traffic, or access with any time intervals (e.g., last month). In doing so, the event category corresponds to the destination IP address and the event label is the source address. The hostname is run as an event action. The Customization tab offers the deepest insights into the NetFlow data with custom reports (Figure 2). In addition to the NetFlow "top-talkers," you will find unwanted protocols (e.g., Telnet, WINS) or servers.

Limited Opportunities
Unfortunately, not all that glitters is gold because Google sets clear limits for the user. Google Analytics limits the number of samples to 200,000 hits per user per day. That is about 700 samples per five-minute interval. Various potential solutions are possible if more NetFlow samples are actually captured. As well as purchasing your own NetFlow server, you can reduce the volume by taking random samples. My flow-ga.pl tool will help if the router manufacturer does not provide a function for reducing the volume of data. The script only sends every nth NetFlow entry via the variable $sampling_rate_N. Alternatively, each router uses a separate NFC (near-field communication) daemon to send different GA properties. Of course, in this situation, Google recommends upgrading to the paid service, Google Analytics Premium, which will work without random sampling if desired.
Using random sampling means that the GA data are no longer 100 percent accurate, but the general (trend) analysis or reports for discovering unknown protocols, services, or servers are still possible. Only enterprise-critical applications, such as payroll systems, should keep clear of these data.
Furthermore, many prebuilt GA topics are designed with a view to website optimization and are therefore useless in the NetFlow environment: interests, technology, mobile, demographic characteristics, conversions, AdWords, and campaigns.
All the information sent to GA is ready for evaluation after about 24 hours. Real-time monitoring is only available to a limited extent under the Real-Time tab, and safety-critical monitoring (e.g., denial of service detection) is unavailable.
Own NetFlow Analyzer as an Alternative
Professional NetFlow analyzers impress with sophisticated reports, support for capacity planning and a whole load of statistics with colorful diagrams. However, the vendors all want a share of what may already be a stretched IT budget. A good open source tool is usually fine for the occasional glance at the acquired NetFlow data. The installation, configuration and maintenance overheads are, however, just the same as for the full use.
Several excellent open source products are available for NetFlow evaluations: NTop, EHNT, or FlowViewer. A server with sufficient memory and disc I/O is required for using these tools. The installation requires Linux knowledge and may not be suitable for a homogeneous Windows environment. The problem with storing NetFlow information locally is the large amount of data. We have handed this challenge off to Google Analytics; unfortunately, at the expense of a fast response.
Conclusions
The words "Google Analytics" set alarm bells ringing for many critical users. As with all external services, it is essential to check whether the data transfer is compatible with your internal company policies and data protection law before using GA. Google Analytics offers anonymization routines, which are also included in the flow-ga.pl script, for IP addresses. Thus, the only information that leaves the enterprise is desired and anonymized.
The use of Google Analytics as a NetFlow analyzer makes it possible to evaluate and monitor your own network without deploying a full-blown server. After several days, enough information will be available to identify meaningful reports about the use and misuse of the IT infrastructure. The advantages and the charm of a NetFlow Analyzer from the cloud still outweigh the drawbacks, even though you will not have 100 percent accurate values for the bandwidth or packets used.
