
Tuning SSD RAID for optimal performance
Flash Stack
Conventional hard disks store their data on one or more magnetic disks, which are written to and read by read/write heads. In contrast, SSDs do not use mechanical components but store data in flash memory cells. Single-level cell (SLC) chips store 1 bit, multilevel cell (MLC) chips 2 bits, and triple-level cell (TLC) chips 3 bits per memory cell. Multiple memory cells are organized in a flash chip to form a page (e.g., 8KB). Several pages then form a block (~2MB).
At this level, the first peculiarity of flash memory already comes to light: Whereas new data can be written to unused pages, subsequent changes are not possible. This only works after the SSD controller has deleted the entire associated block. Thus, a sufficient number of unused pages must be available. SSDs have additional memory cells (spare areas), and depending on the SSD, the size of the spare area is between 7 and 78 percent of the rated capacity.
One way of telling the SSD which data fields are no longer used and can therefore be deleted is with a Trim (or TRIM) function. The operating system tells the SSD controller which data fields can be deleted. Trim is easy to implement for a single SSD, but for parity RAID, the implementation would be quite complex. Thus far, no hardware RAID controller supports Trim functionality. This shortcoming can be easily worked around, however: Most enterprise SSDs natively come with a comparatively large spare area, which is why Trim support hardly matters. And, if the performance is not good enough, you use overprovisioning – more on that later.
Metrics
When measuring SSD performance, three metrics are crucial: input/output operations per second (IOPS), latency, and throughput. The size of an I/O operation is 4KB unless otherwise stated; IOPS are typically "random" (i.e., measured with randomly distributed access to acquire the worst-case values). Whereas hard drives only manage around 100-300 IOPS, current enterprise SSDs achieve up to 36,000 write IOPS and 75,000 read IOPS (e.g., the 800GB DC S3700 SSD model by Intel).
Latency is the wait time in milliseconds (ms) until a single I/O operation has been carried out. The typical average latency for SSDs is between 0.1 and 0.3ms, and between 5 and 10ms for hard disks. It should be noted that hard disk manufacturers typically publish latency as the time for one-half revolution of the disk. For real latency, that is, the average access time, you need to add the track change time (seek time).
Finally, throughput is defined as the data transfer rate in megabytes per second (MBps) and is typically measured for larger and sequential I/O operations. SSDs achieve about twice to three times the throughput of hard drives. For SSDs with a few flash chips (lower capacity SSDs), the write performance is somewhat limited and is approximately at hard disk level.
The following factors affect the performance of SSDs:
- Read/write mix: For SSDs, the read and write operations differ considerably at the hardware level. Because of the higher controller overhead of write operations, SSDs typically achieve more write IOPS than read IOPS. The difference is particularly high for consumer SSDs. With Enterprise SSDs, the manufacturers improve write performance by using a larger spare area and optimizing the controller firmware.
- Random/sequential mix: The number of possible IOPS also depends on whether access is distributed randomly over the entire data area (logical block addressing LBA range) or occurs sequentially. In random access, the management overhead of the SSD controller increases, and the number of possible IOPS thus decreases.
- Queue depth: Queue depth refers to the length of the queue in the I/O path to the SSD. Given a larger queue (e.g., 8, 16, or 32), the operating system groups the configured number of I/O operations before sending them to the SSD controller. A larger queue depth increases the possible number of IOPS, because the SSD can send requests in parallel to the flash chips; however, it also increases average latency, and thus wait time for a single I/O operation, simply because each individual operation is not routed to the SSD immediately, but only when the queue is full.
- Spare area: The size of the spare area has a direct effect on the random write performance of the SSD (and thus on the combination of read and write performance). The larger the spare area, the less frequently the SSD controller needs to restructure the internal data. The more time the SSD controller has for host requests, the more random write performance increases.
Determining Baseline Performance
Given the SSD characteristics above, specially tuned performance testing is essential. More specifically, the fresh-out-of-the-box condition and the transition phases between workloads make it complicated to measure performance values reliably. The resulting values thus depend on the following factors:
- Write access and preconditioning – the state of the SSD before the test.
- Workload pattern – the I/O pattern (read/write mix, block sizes) during the test.
- Data pattern – the data actually written.
The requirements for meaningful SSD tests even prompted the Storage Networking Industry Association (SNIA) to publish its own enterprise Performance Test Specification (PTS) [1].
In most cases, however, there is no possibility of carrying out tests on this scale. It is often sufficient, in the first step to deploy simple methods for determining a baseline performance of the SSD. This will give you the metrics (MBps and IOPS) tailored for your system.
Table 1 looks at the Flexible I/O Tester (FIO) [2] performance tool. FIO is particularly common in Linux but is also available for Windows and VMware ESXi. Developed by the maintainer of the Linux block layer, Jens Axboe, this tool draws on some impressive knowledge and functionality. Use the table for a simple performance test of your SSD on Linux. Windows users will need to remove the libaio and iodepth parameters.
Tabelle 1: FIO Performance Measurement
|
Test |
Command |
|---|---|
|
Read throughput |
|
|
Write throughput |
|
|
IOPS read |
|
|
IOPS write |
|
|
IOPS mixed workload (50% read/50% write) |
|
RAID with SSDs
An analysis of SSDs in a RAID array shows how the performance values develop as the number of SSDs increases. The tests also cater to the different RAID level characteristics.
The hardware setup for the RAID tests are Intel DC S3500 series 80GB SSDs, an Avago (formerly LSI) MegaRAID 9365 RAID controller and a Supermicro X9SCM-F motherboard. Note that the performance of an SSD within a series also depends on its capacity. A 240GB model has performance benefits over an 80GB model.
The performance software used in our lab was TKperf on Ubuntu 14.04. TKperf implements the SNIA PTS with the use of FIO. Since version 2.0, it automatically creates Linux software RAID (SWR) arrays using mdadm and hardware RAID (HWR) arrays storcli with Avago MegaRAID controllers. Support for Adaptec RAID controllers is planned.
RAID 1
The commonly used RAID 1 provides resiliency. Read access benefits because the two SSDs are accessed simultaneously. Both SWR and HWR confirm this assumption and achieve around 107,000 and 120,000 random read IOPS (4KB block size), which is more than 1.4 times that of a single SSD. The RAID array should execute random writes as fast as an SSD however, tests reveal performance penalties for SWR and HWR of about 30 percent for random writes and 50/50 mixed workloads.
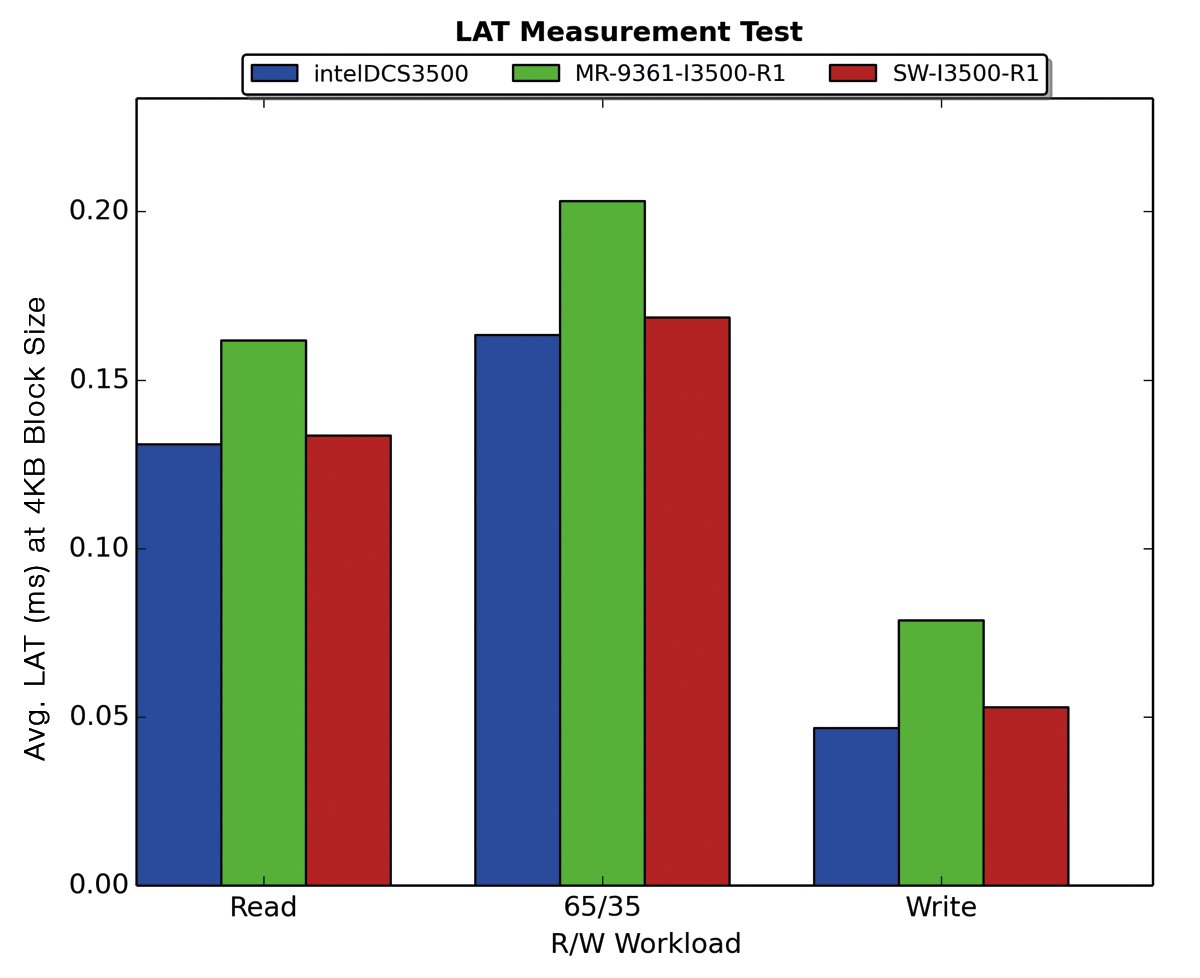
The latency test for the SWR shows some pleasing results. The latencies in all three workloads are only minimally above those of a single SSD. In terms of HWR, the RAID controller adds latency. A constant overhead of approximately 0.04ms is seen across all workloads (Figure 1).
RAID 5
RAID level 5 is characterized by its use of parity data, which causes additional overhead in write operations. The additional overhead is clearly reflected in the results of IOPS tests. A RAID 5 with three SSDs achieved 4KB IOPS in a random write test, on a par with a single SSD. Anyone who believes that adding another SSD will significantly increase write performance for RAID 5 is wrong. Intel analyzed this situation in detail in a whitepaper [3]. Double the IOPS performance compared with three SSDs is only achieved in write operations as of eight SSDs in RAID 5. When comparing HWR and SWR, the contenders are on par with three SSDs. The setup with four SSDs in RAID 5 is more favorable for SWR. Mixed workloads and write-only operations at 4KB reveal a performance of approximately 4,000 IOPS for the HWR. Figure 2 summarizes the results of a single SSD by HWR and SWR with three and four SSDs in RAID 5.
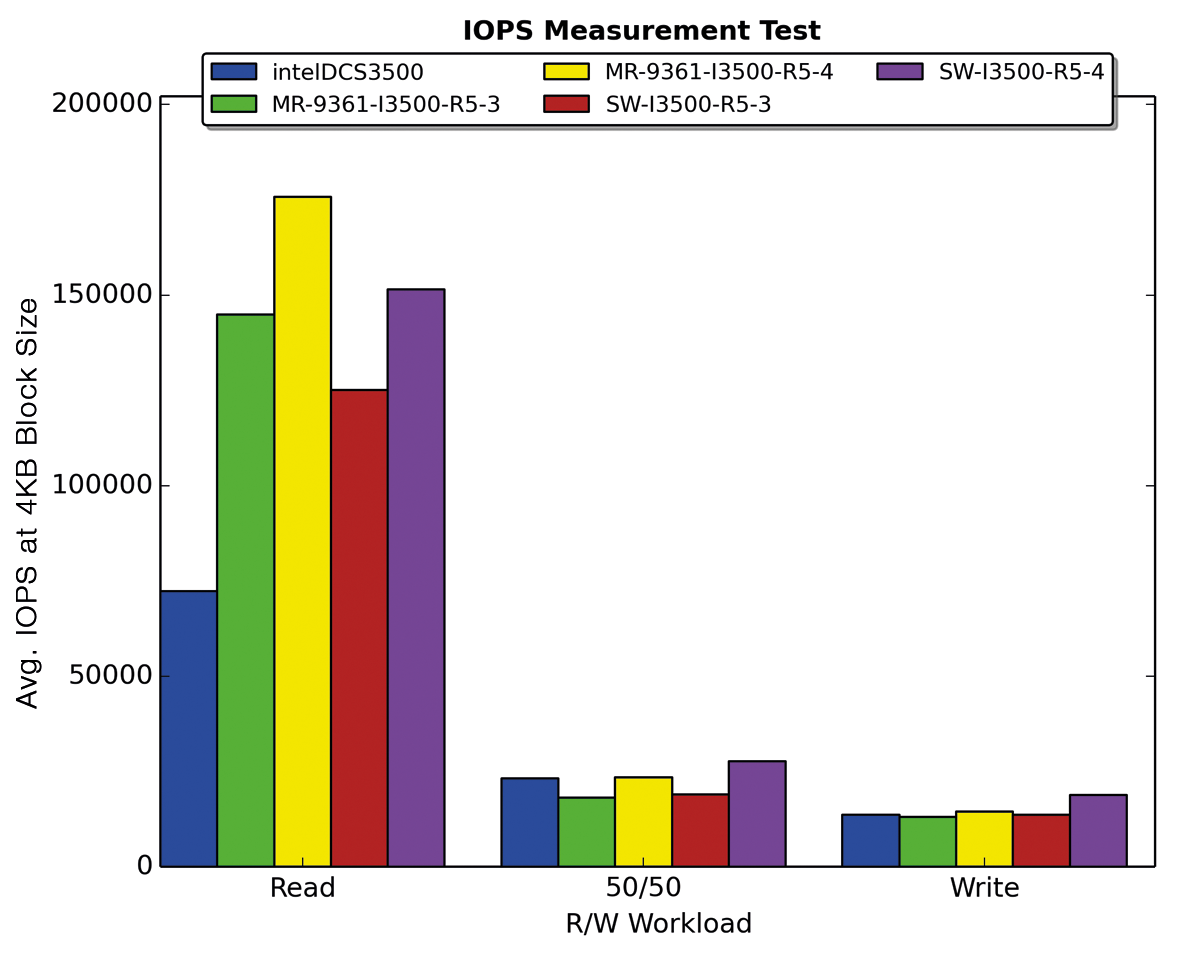
The more read-heavy the workload becomes, the less noticeable the parity calculations are. With four SSDs in a RAID 5 setup, the HWR achieves almost 180,000 IOPS – more than double the performance of a single SSD. SWR does not quite achieve this number, just exceeding the 150,000 IOPS mark. The latency test illustrates the differences between read and write access. About 0.12ms are added from read only, through 65/35 mixed, to write only in a HWR. The increase is about 0.10ms per workload in the SWR.
RAID 5 also impresses with its read throughput for 1,024KB blocks. The HWR with four SSDs in a RAID 5 setup handles more than 1.2GBps, whereas the SWR lags slightly behind at 1.1GBps. The write throughput is limited by the 80GB model, which is 100MBps according to the specs. The four SSDs in RAID 5 achieve around 260MBps in the HWR tests and 225MBps in the SWR tests.
RAID 10
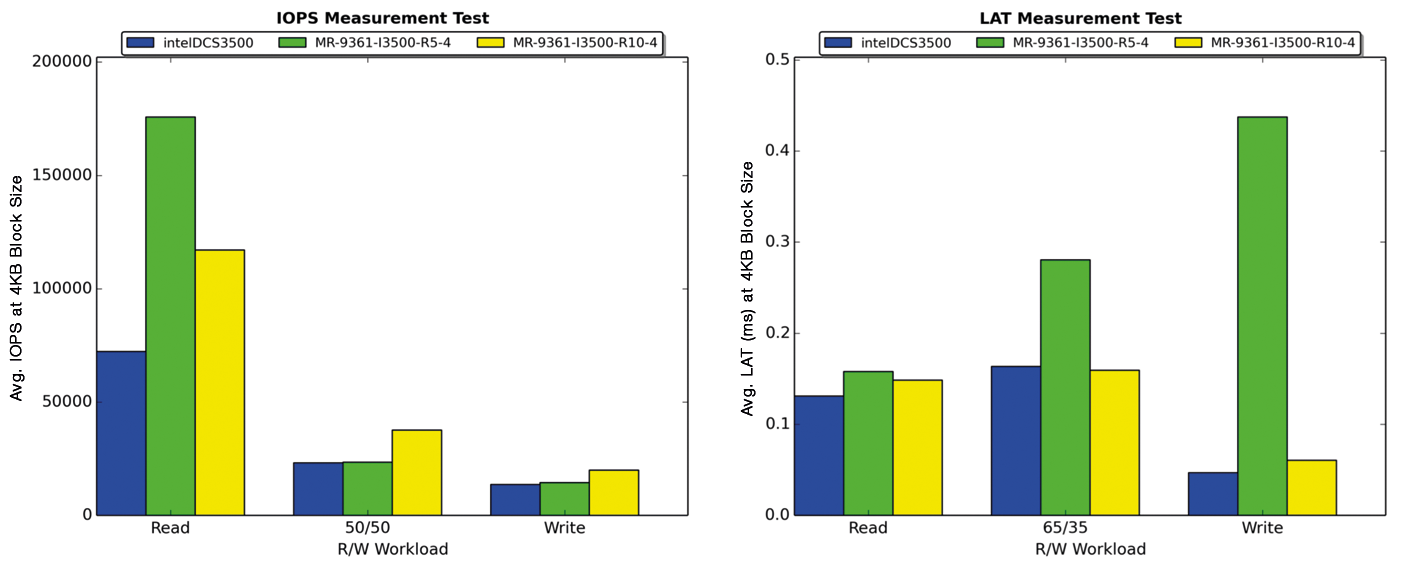
As the name implies, RAID 10 is a combination of RAID 1 and RAID 0 (sometimes also referred to as RAID 1+0). In setups with four SSDs, a direct performance comparison with RAID 5 makes sense. Only 50 percent of the net capacity is available in RAID 10, but with many random writes, you see major benefits compared with RAID 5. Figure 3 clearly shows the weakness of RAID 5 in terms of write IOPS. Likewise, the increased latency in RAID 5 from parity calculations is noticeable. Compared with this, RAID 10 achieves latencies that are on a par with those of a single SSD. If you are not worried about write performance and latencies, then you can safely stick with RAID 5.
Effective Tuning Measures
When using hardware RAID controllers for SSD RAID, the following recommendation applies: Use the latest possible version of the RAID controller! Firmware optimizations for SSD are significantly better in newer RAID controllers than older models. The Avago MegaRAID controllers (e.g., the new 12GB SAS controller) now integrate a feature (FastPath) for optimizing SSD RAID performance out the box.
To improve performance of hard disk drive (HDD) RAID arrays, hardware RAID controllers were equipped with a cache at a very early stage. Current controllers have 512MB to 1GB of cache memory for use both in read (write cache) and write access (read ahead). For SSD RAID, however, you will want to steer clear of using this cache memory for the reasons discussed above.
Disabling Write Cache
With HDD RAID, write caching (writeback policy) offers a noticeable performance boost. The RAID controller cache can optimally cache small and random writes in particular before writing them out to comparatively slow hard disks. The potential write performance thus increases from a few hundred to several thousand IOPS. Additionally, latency is reduced noticeably – from 5 to 10ms to less than 1ms. In RAID 5 and 6 with HDDs, the write cache offers another advantage: Without cache memory, the read operation required for parity computation (read-modify-write) would slow down the system further. Thanks to the cache, the operation can be time staggered. To ensure that no data is lost during a power failure, a write cache must be protected with a battery backup unit (BBU) or flash protection module (LSI or Adaptec CacheVault ZMCP).
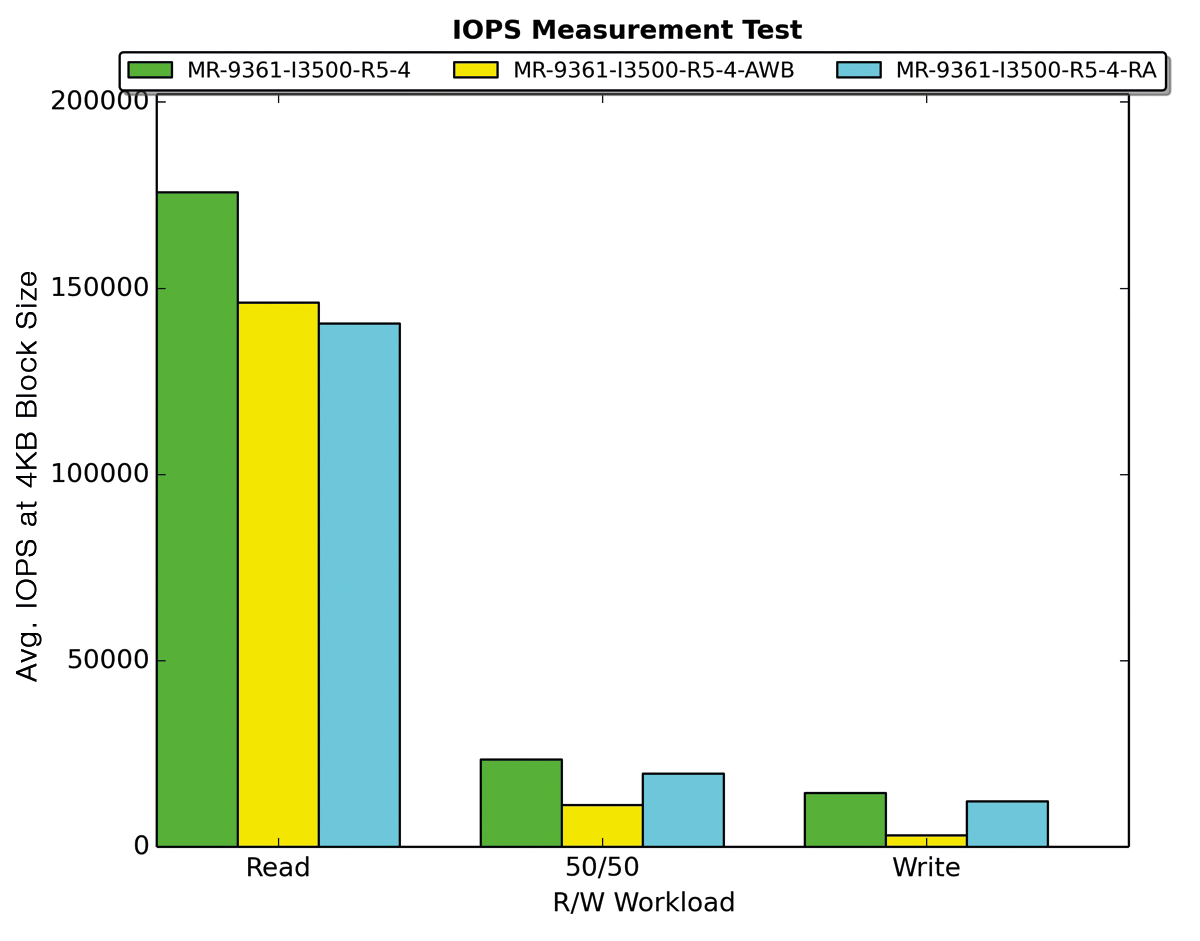
With SSDs, everything is different: Their performance is already so high that a write cache only slows things down because of the associated overhead. This is confirmed by the measurement results in Figure 4: In a RAID 5 with four SSDs, the write IOPS decreased with writeback activated from 14,400 to 3,000 – nearly 80 percent fewer IOPS. The only advantage of the write cache is low write latencies for RAID 5 sets. Because latencies are even lower for RAID 1 (no parity calculations and no write cache), this advantage is quickly lost. The recommendation is thus: Use SSD RAID without write cache (i.e., write through instead of write back). This also means savings of about $150-$250 for the BBU or flash protection module.
Disabling Read Ahead
Read ahead – reading data blocks that reside behind the currently requested data – is also a performance optimization that only offers genuine benefits for hard disks. In RAID 5 with four SSDs, activating read ahead slowed down the read IOPS these tests by 20 percent (from 175,000 to 140,000 read IOPS). In terms of throughput, you'll see no performance differences for reading with 64KB or 1,024KB blocks. Read ahead only offered benefits in our lab in throughput with 8KB blocks. Additionally, read ahead can only offer benefits in single-threaded read tests (e.g., with dd on Linux). However, both access patterns are atypical in server operations. My recommendation is therefore to run SSD RAIDs without read ahead.
Overprovisioning
As already mentioned, the size of the spare area has a direct effect on the random write performance of an SSD. Even a small increase in the spare area will significantly increase the random write performance and durability of an SSD. This recommendation from the early days of the SSD era is still valid today. For the current crop of SSDs, however, durability is already sufficient to make an increase in the spare area useful for performance reasons.
You can easily increase the size of the spare area with manual overprovisioning by only configuring part of the capacity of the SSD for the RAID set (about 80 percent) and leaving the rest blank. If you have previously used the SSD, perform a secure erase first to wipe all the flash cells. Only then can the SSD controller use this free space as a spare area. As Figure 5 shows, write IOPS almost tripled given 20 percent overprovisioning (with an Intel DC S3500 800GB SSD).
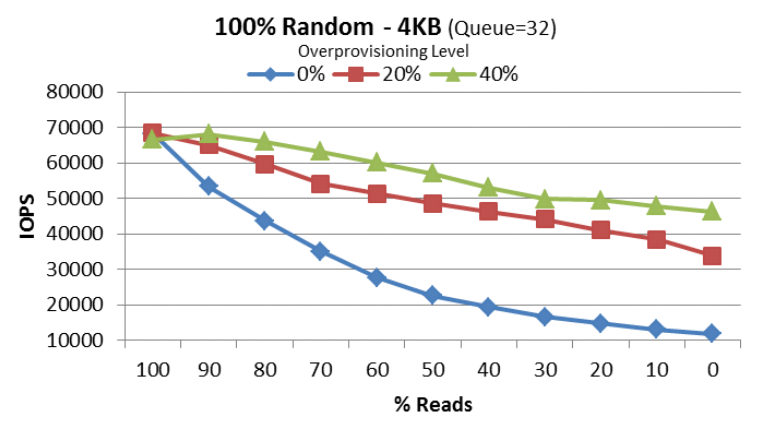
A little note on the side: Overprovisioning does not affect the read-only or sequential write performance; that is, performance benefits are only up for grabs if you have a random mix of read/write or write-only workloads.
Linux Deadline I/O Scheduler
For SSDs and SSD RAID the deadline I/O scheduler offers the best performance in my experience. As of Ubuntu 12.10, Ubuntu uses the deadline scheduler by default; other distributions still partially rely on the CFQ scheduler, which was optimized with hard disks in mind. Typing a simple
cat /sys/block/sda/queue/scheduler
lets you check which scheduler is used (for the sda device) in this case. Working as root, you can set the scheduler to deadline scheduler like this:
echo deadline > /sys/block/sda/queue/scheduler
For details of permanently changing the scheduler, see the documentation of the Linux distribution that you use. In the medium term, the Linux multiqueue block I/O queueing mechanism (blk-mq) will replace the traditional I/O schedulers for SSDs. But, it will take some time for blk-mg to find its way into the long-term support enterprise distributions.
Monitoring the Health of SSDs and RAID
The flash cells in an SSD can only handle a limited number of write cycles. The finite lifetime is attributable to the internal structure of the memory cells, which are exposed to program/erase (P/E) cycles during write access. The floating gate of the cell, which is used to write to the cell, wears in each cycle. If the wear threshold of a certain cell is exceeded, the SSD's controller tags the cell as a bad block and replaces it with one from the spare area. At least two indicators are derived directly from this function: (1) the wear of the flash cells via the media wearout indicator and (2) the number of remaining spare blocks (a.k.a. available reserved space).
Optimally, the manufacturer passes these two values on to the user as self-monitoring analysis and reporting technology (SMART) attributes. For proper monitoring of the attributes, a detailed SMART specification of the SSD is essential. The interpretation of these values is not standardized and varies from manufacturer to manufacturer. As an example, Intel and Samsung attributes differ in terms of ID and name, but the values they use are at least equal. Using the smartctl command-line tool, you can access SMART attributes for your SSD; this is also possible for megaraid and sg devices residing behind Avago MegaRAID and Adaptec controllers,
smartctl -a /dev/sda
smartctl -a -d megaraid,6 /dev/sda
smartctl -a -d sat /dev/sg1
illustrating how important it is that the manufacturers disclose their specifications for reliable monitoring. Intel is exemplary in its datacenter SSDs and provides detailed specifications, including SMART attributes.
The integration of SMART monitoring into a monitoring framework like Icinga is the next step. A plugin must be able to respond to the manufacturer's specification and interpret the attribute values correctly. The Thomas Krenn team has developed check_smart_attributes [4], a plugin that maps the attribute specifications to a JSON database. As of version 1.1, the plugin also monitors SSDs residing behind RAID controllers.
SMART attributes uniquely determine the wear of flash cells, from which the durability of the SSD is derived. Other attributes complete the SSD health check for enterprise use. At Intel, one example is the Power_Loss_Cap_Test attribute, which relates to the correct function of the SSD's integrated cache protection. Cache protection ensures that no data is lost in a power outage. This attribute shows the importance of regular testing of SSD SMART attributes. You need to make sure detailed information for the SMART attributes exists before you deploy SSDs on a larger scale.
Checking RAID Consistency
In addition to testing SMART attributes, consistency checks are a further component in optimal RAID operation. Hardware RAID manufacturers also refer to consistency checks as "verification." The mdadm software implements the functionality with the checkarray script. No matter what technology you use, regular consistency checks discover inconsistencies in data or checksums. Therefore, make sure you run regular consistency checks on your system.
1. Mdadm typically sets up a cronjob in /etc/cron.d/mdadm. Every first Sunday of the month, the job starts a consistency check for configured software RAID. But beware – make sure after the check that the associated counter is 0 in sysfs:
$ cat sys/block/md0/md/
mismatch_cnt
0
Although the script checks the RAID array for consistency, it does not perform any corrections itself. Mismatches are indicative of hardware issues for RAID levels 4, 5, and 6. RAID 1 and 10 can also produce mismatches without an error, especially if swap devices are located on them. If an error occurs, incidentally, mdadm sends email only if you enter the correct address in the mdadm.conf file under MailAddr.
2. The MegaRAID Storage Manager (MSM) is the first stop for regular consistency checks for LSI. One clear advantage is that MSM runs on Windows, Linux, and VMware ESXi. The Controller section takes you to the Schedule Consistency Check tab. You can define when and how often to run a check.
3. The Adaptec command-line tool enables consistency checks via the datascrub command. Data scrubbing is often used in the context of consistency checks because it designates the process of error correction. The command
$ arcconf datascrub 1 period 30
sets up a regular check every 30 days.
Conclusions
Current RAID controllers experience no problems with SSD RAID, and performance compares well with Linux software RAID. The choice of RAID technology is therefore mainly a question of the operating system and personal preferences. Linux with recent kernels and mdadm definitely has all the tools you need for SSD RAID on-board. (See the "Checkbox for SSD RAID" box.) One thing is clear: Controller cache and read ahead are not useful for SSD RAID. You can also save yourself the trouble of BBU or flash-based cache protection solutions.
Choosing the right RAID level is your responsibility. You need to roll up your sleeves and analyze your applications or systems. Is your I/O primarily write or read? If random reads are the prime focus, RAID 5 is a good choice, while keeping capacity losses low. The classic RAID 1 is not totally out of fashion with SSDs. Solid latencies and 40 percent higher read IOPS than a single SSD speak for themselves. You can expect write IOPS hits in both RAID 5 and RAID 1. If you are thinking of purchasing a large number of SSDs and would like to achieve balanced performance, there is no alternative to RAID 10. Write performance, latency, and read IOPS with RAID 10 are all very much what the admin ordered.
