Monitoring containers
On-Screen
When administrators monitor containers, they first need to consider what expectations they have with respect to the monitoring tool. Is it important to know the load the containers generate on the host resources, or is availability of the containerized services of more interest? Existing monitoring solutions can be used in part for both use cases.
Rough Overview
Docker [1] offers a variety of information related to the containers [2], but only as a starting point for tools with more complex monitoring approaches. Docker does not format the data, but it does support a couple of commands that at least allow administrators to establish rudimentary container monitoring.
The docker ps command lists all active containers – or those that have run – on a host (Figure 1). This command gives you a rough overview of whether containers are still running and an application is therefore available. Additionally, the command reveals other details, such as open and forwarded ports. If the system terminates an application, you get to see a return code.

docker ps command provides an overview of the active containers.The docker logs command queries what the applications running in the containers send to stdout and stderr. If you scan these logs, you can also establish a simple monitoring setup. For the command to work, you first need to enable the logging driver, json-file, which is installed by default. Alternatively, you can select syslog or journald as the logging target, which gives you better options for processing the output.
The docker stats command (Figure 2) shows CPU usage, memory usage, and network I/O. The data display is refreshed automatically. If you want to automate the process, you are better off disabling this feature with the --no-stream parameter, so you only see the first result for each case.

docker stats shows rudimentary statistics for the selected container.If you want to process the data downstream, it might be more useful to tap directly into the source of the resource statistics, cgroups, which organizes processes hierarchically to manage them in groups. Cgroups also allows logging of resource statistics, which then form the basis for the docker stats command.
By default, systemd stores the cgroups data on the filesystem below /sys/fs/cgroup. Each active cgroup subsystem has a folder here, in which the system maps the hierarchical structure of the processes. If you look below /sys/fs/cgroup/memory/system.slice/docker-<container-ID>.scope/memory.stat, for example, you will find the RAM statistics for the container.
The tools provided by Docker give you a rough overview for a host, but it is difficult to use them for widespread monitoring. Admins need to use different tools for this purpose.
Live Container Statistics
One tool comes from the Google cAdvisor [3] project. Originally designed for Google's own lmctfy (let me contain that for you), it now also supports Docker, assuming that Docker uses the libcontainer library (which is enabled by default since version 1.0) as its execution driver. Installing as a Docker container is the easiest way of starting a cAdvisor instance.
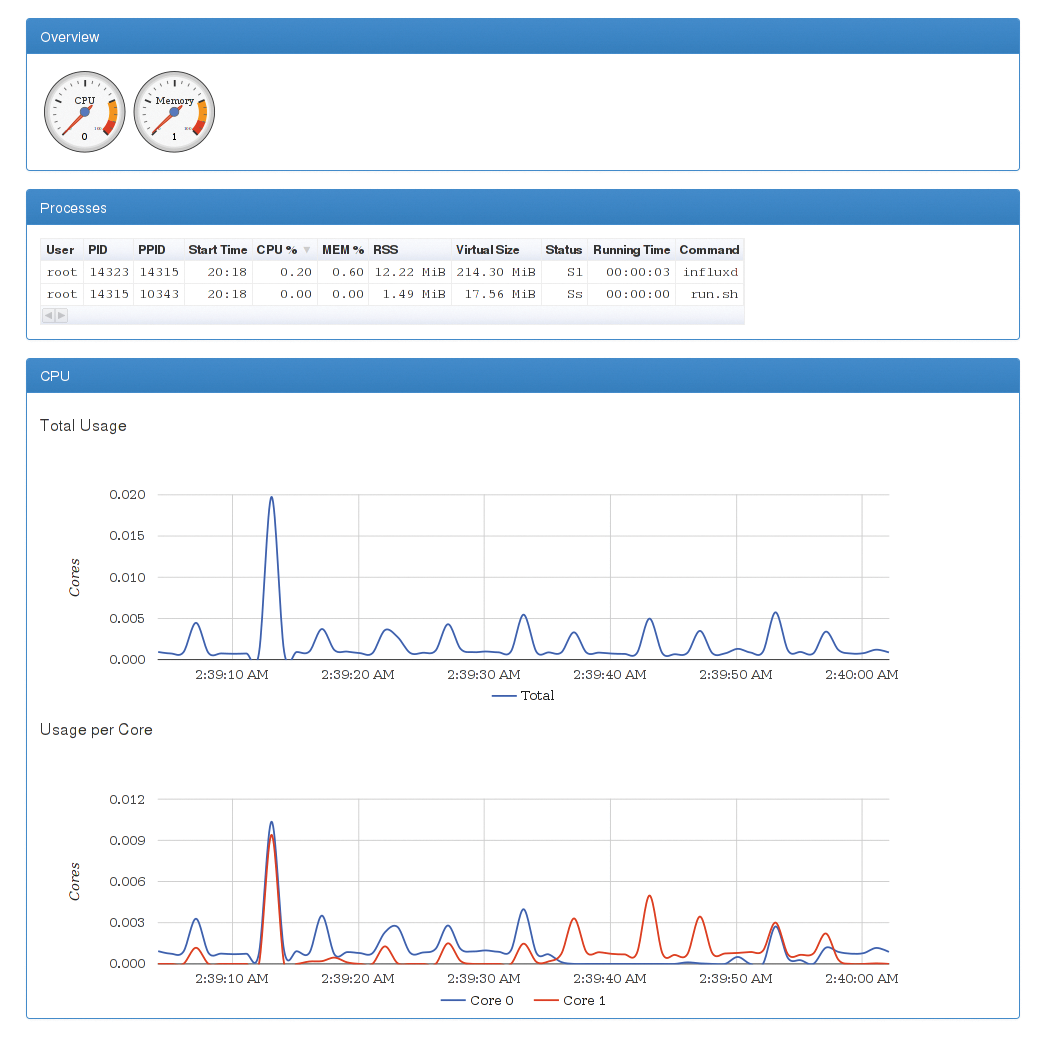
The tool visualizes the performance and load data in a web interface that automatically refreshes (Figure 3). The interface shows the results for the entire host or for individual containers; the statistics include CPU load, memory consumption, network traffic, and occupied disk space, giving the admin a rapid overview of the host's load state and the container states.

cAdvisor refreshes data on the fly with graphics that visualize the captured data. By default, the software does not cache the data. To compensate, Google lets you write the performance data to an InfluxDB [4] database, which stores the data for later evaluation; however, this is not handled by cAdvisor. Instead, other tools step in.
One of the tools that generates graphics from the statistics in InfluxDB is Grafana [5], a fork of Kibana [6] used in the ELK (Elasticsearch, Logstash, Kibana) stack. Grafana impresses with a configurable dashboard on which data is visualized. Users can generate and display their own graphs from the existing data. Various chart types are supported (e.g., dot, bar, or line diagrams). Additional options can be configured, such as data point stacking or percentage displays. Plugins let you add additional chart types.
The combination of InfluxDB and Grafana allows you to use cAdvisor for a large number of hosts. Additionally, it consolidates the display of data in graphs or dashboards and outputs them to the screen for a useful overview, helping admins keep track of their Docker landscape at all times.
The development roadmap contains plans to add more advanced features to cAdvisor and proposes container performance optimizations. Moreover, cAdvisor will be able to fine-tune containers automatically for the best possible performance. The load predictions required for this will also be available for cluster managers.
In the Cockpit
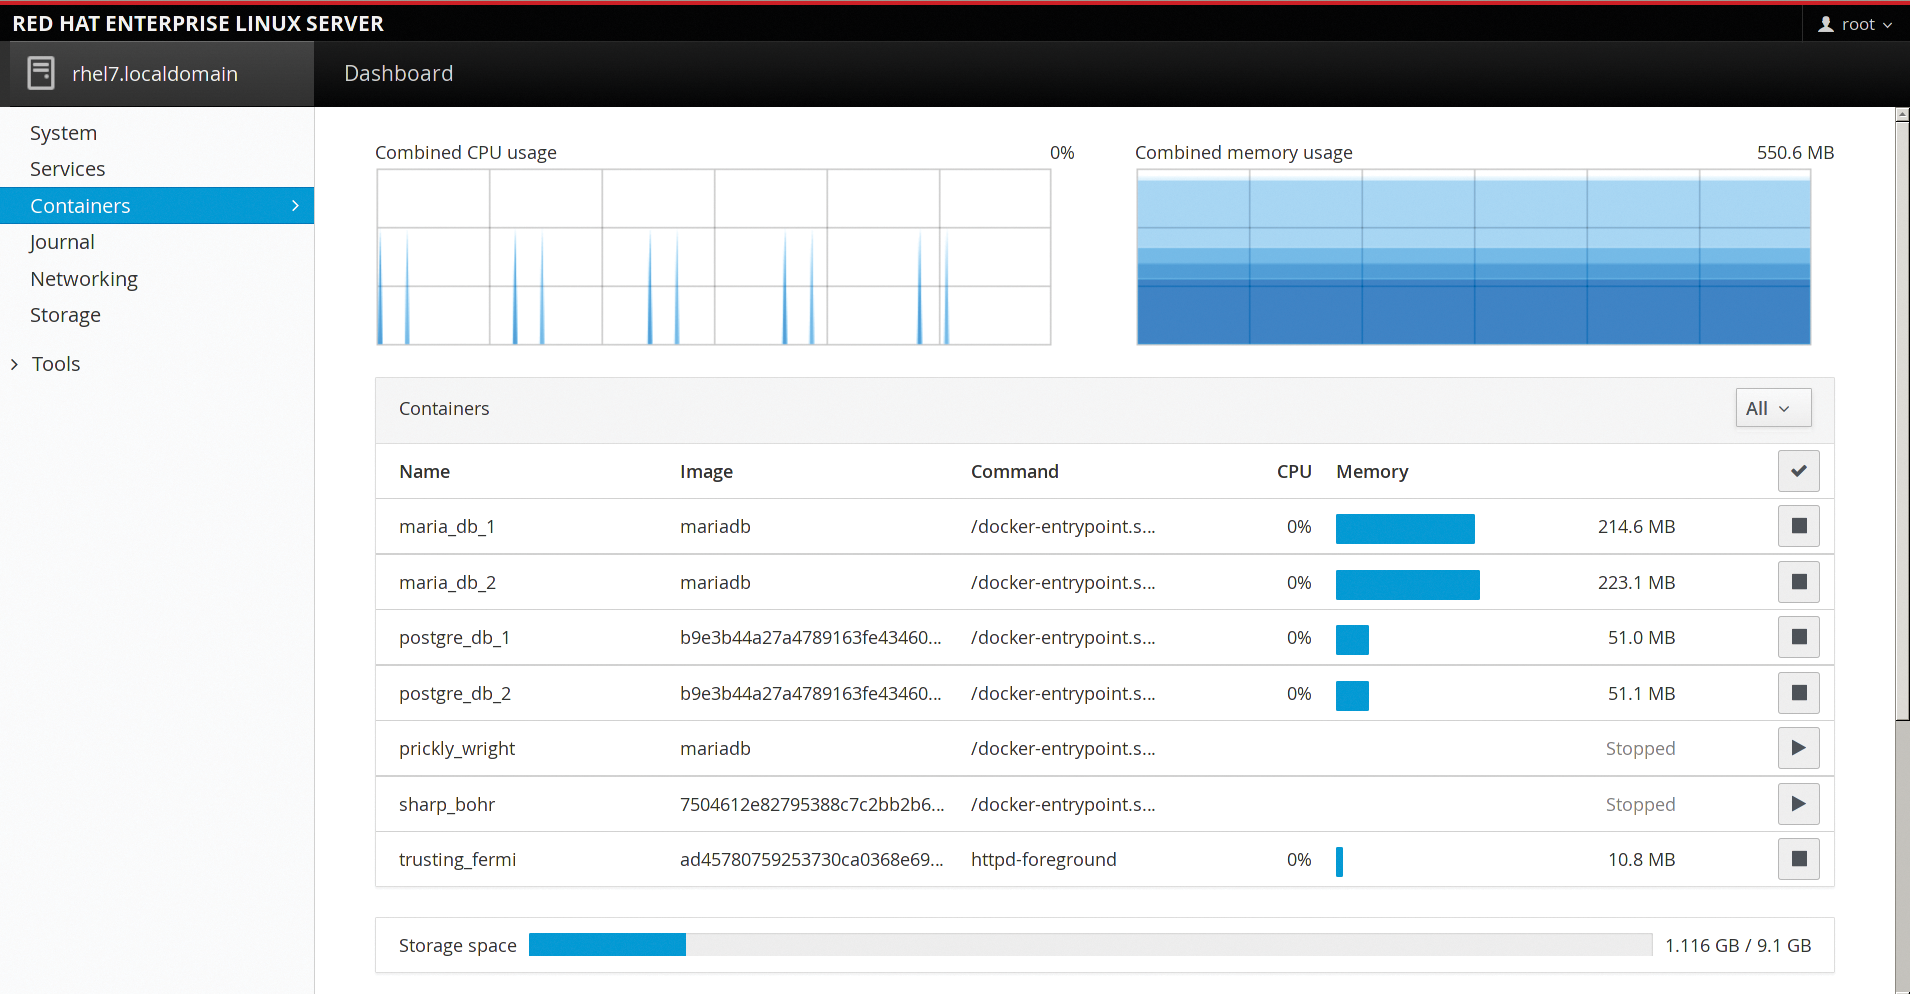
The Red Hat Cockpit [7] project not only manages servers, it also adds a container manager to the service. The manager starts and stops containers and provides an overview of the resources the containers use. It captures the generated CPU load, RAM usage, and disk space occupied by the images (Figure 4).

Cockpit monitors CPU and RAM usage and visualizes the results in graphs. It additionally lists the resource usage for each container in an overview. Unfortunately, Cockpit lacks a function for sorting containers by CPU usage or memory load, which means that the list – on a host with many containers – can quickly become cluttered. Additionally, the data is displayed in graphs with graduated blue tones. If you manage a large number of containers, it can be difficult to see which container is using what resources.
Cockpit is not suitable as a monitoring solution in a large environment because it lacks the ability to aggregate multiple hosts. What's more, it has no options for issuing alerts if a container stops running (i.e., if a service is no longer available). On smaller systems, however, Cockpit offers a good, although not very detailed, overview of the active containers and the resources they use.
Monitoring with Nagios
To monitor containers in existing monitoring solutions, you can obtain plugins. New Relic [8] offers the check_docker extension (written in Go) for Nagios [9] [10]. It uses the Docker REST API to pick up information. However, by default, it only queries the host's (meta)data load, for which the administrator can set warnings and critical thresholds.
If needed, you can also stipulate that a container with a specific image is to be run on a specific host. This can be useful if you want to run check_docker in parallel with cAdvisor. In this case, you need to launch cAdvisor as a container on each host; then, you use Nagios to check that this is really happening and whether a container of this type really is running on each Docker host.
The master version of check_docker also queries certain container names. If you choose mnemonic container names, you can thus keep track of multiple containers that originate from the same image. Additionally, you can use check_docker without a Nagios instance to evaluate your data manually. That said, you would lose one of the biggest benefits included as part of the Icinga and Nagios packages: the ability to send alerts.
The check_docker plugin proves to be a useful supplement to performance monitoring tools such as cAdvisor, and it integrates seamlessly with an existing Nagios/Icinga landscape. However, the REST API does add to the configuration overhead that administrators need to schedule to secure communication with TLS certificates that lock out unauthorized intruders.
Variants and Combinations
Many of the projects listed here are based on a combination of existing tools. The Heapster [11] tool used for resource monitoring in Kubernetes [12], for example, relies on cAdvisor and InfluxDB. Visualization then relies on either Grafana or Kubernetes' own Kubedash [13]. Dockerana [14], which took first place at the DockerCon 2014 Hackathon, also uses Grafana with Graphite [15] for data storage on top.
More complex monitoring solutions require a combination of these tools, including a source that only collects the data, such as cAdvisor or collectd [16]; a cache for the data metrics, such as Graphite or InfluxDB; and a service for visualizing the data (e.g., Grafana). Each of these services comes with its own configuration. Coordinating the way they collaborate is anything but trivial, but if you take the time, you will reap the rewards of versatile monitoring options.
If you do not want to host your monitoring system yourself, you can turn to a commercial service, such as New Relic [8], Sysdig Cloud [17], or Datadog [18]. At the opposite end of the field are plainer, self-hosted solutions, including Cockpit, cAdvisor, or a Nagios instance that offer comparatively fewer features.
For smaller environments, in which only the current load is of interest, you might even get away with using the built-in Docker commands, so no external tools are required. cAdvisor dresses the data in graphics and is easily installed as a Docker container. Red Hat-based systems come with Cockpit, which even includes a basic container deployment tool.
If you are already using a monitoring solution for other servers (e.g., Sensu [19] or Nagios), plugins can make your solution Docker-ready. In this case, you do not need additional, complex monitoring software for your containers, and you can leverage the existing features, such as alerting, into the bargain.
If you are planning a large-scale Docker environment, it makes sense to take a look at monitoring tools tailored for the job. Although they might require more configuration overhead, they do offer the most extensive data aggregation and visualization opportunities. Container tamers can either compose a solution from the individual components or deploy a project, such as Prometheus [20] or Heapster, that handles some of the overhead. A word of warning: The tools are still under pretty heavy development, so you have some risk of incompatibility between versions. A comprehensive test environment is mandatory.
