
Fundamentals of I/O benchmarking
Measure for Measure
Administrators wanting to examine a specific storage solution will have many questions. To begin: What is storage performance? Most admins will think of several I/O key performance indicators (KPIs), for which the focus is on one or the other. However, these metrics describe different things: Sometimes they relate to the filesystem, sometimes to raw storage, sometimes to read performance, and sometimes to write performance. Sometimes a cache is involved and sometimes not. Moreover, the various indicators are measured by different tools.
Once you have battled through to this point and clarified what you are measuring and with which tool, the next questions are just around the corner: Which component is the bottleneck that is impairing the performance of the system? What storage performance does your application actually need? In this article, we will help you answer all these questions.
Fundamentals
An I/O request passes through several layers (Figure 1) in the operating system. These layers each build on one another. For example, the application and filesystem layer (with technologies such as LVM, DRBD, mdadm, multipathing, devmapper, etc.) is based on the block virtualization layer. Closer to the hardware, you will find the block layer, the SCSI layers, and finally the devices themselves (RAID controllers, HBAs, etc.).
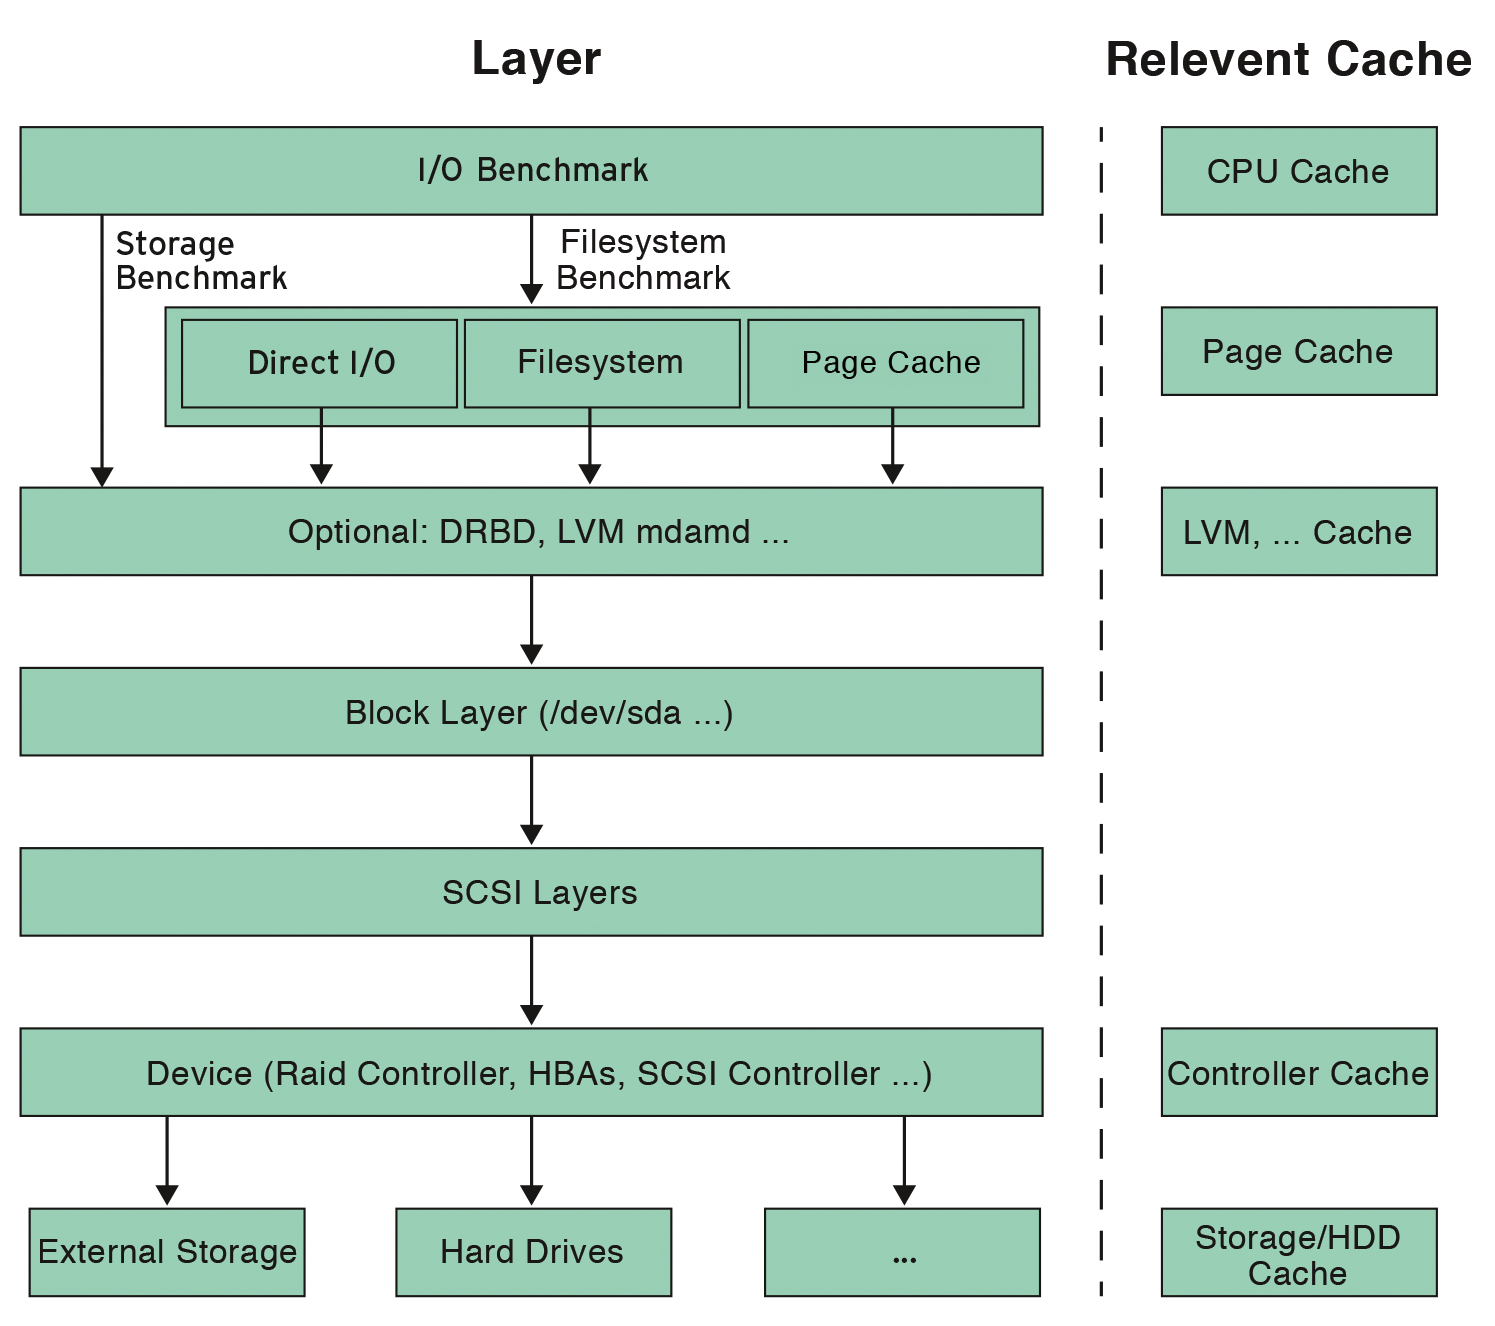
Some of the layers in Figure 1 have their own cache. Each can perform two tasks: Buffering data to offer better performance than would be possible with the physical device alone, and collating requests to create a few large requests from a large number of smaller ones. This is true both for reading and writing. For read operations there is another cache function, that is, proactive reading (read ahead), which retrieves neighboring blocks of data without a specific request and stores them in the cache because they will probably be needed later on.
The processor and filesystem cache is volatile; it only guarantees that all data is stored safely after a sync operation. The block virtualization layer's cache depends on the technique used (DRBD, LVM, or similar). The cache on RAID controllers and external storage devices is typically battery buffered. What has arrived here can therefore be considered safe and will survive a reboot.
In this article, the term "storage benchmark" refers to an I/O benchmark that bypasses the filesystem and accesses the underlying layer (e.g., device files such as /dev/sda or /dev/dm-0) directly.
In comparison, a filesystem benchmark addresses the filesystem but does not necessarily use the filesystem cache. The use of this cache is known as buffered I/O, and bypassing it is known as direct I/O. A pure filesystem benchmark is therefore without prejudice to the layers in the filesystem, so it is possible to compare filesystems.
Indicators
Throughput is certainly the most prominent indicator. The terms "bandwidth" or "transfer rate" are considered synonyms. They describe the number of bytes an actor can read or write per unit of time. Therefore, the throughput for copying large files, for example, determines the duration of the operation.
IOPS (I/O operations per second) is a measure of the number of read/write operations per second that a storage system can accommodate. Such an operation for SCSI storage (e.g., "read block 0815 from LUN 4711") takes time, which limits the possible number of operations per unit time, even if the theoretically possible maximum throughput has not been reached. IOPS are particularly interesting for cases in which there are many relatively small blocks to process, as is often the case with databases.
Latency is the delay between triggering an I/O operation and the following commit, which confirms that the data has actually reached the storage medium.
CPU cycles per I/O operation is a rarely used counter but an important one all the same, because it indicates the extent to which the CPU is stressed by I/O operations. This is best illustrated by the example of software RAID: For software RAID 5, checksums are calculated for all blocks, which consumes CPU cycles. Also, faulty drivers are notorious for burning computational performance.
Two mnemonics will help you remember this. The first is: "Throughput is equivalent to the amount of water flowing into a river every second. Latency is the time needed for a stick to cover a defined distance on the water." The second is: "Block size is equivalent to the cargo capacity of a vehicle." In this case, a sports car is excellent for taking individual items from one place to another as quickly as possible (low latency), but in practice, you will choose a slower truck for moving a house: It offers you more throughput because of its larger cargo volume.
Influencing Factors
The indicators will depend on several factors (Figure 2):
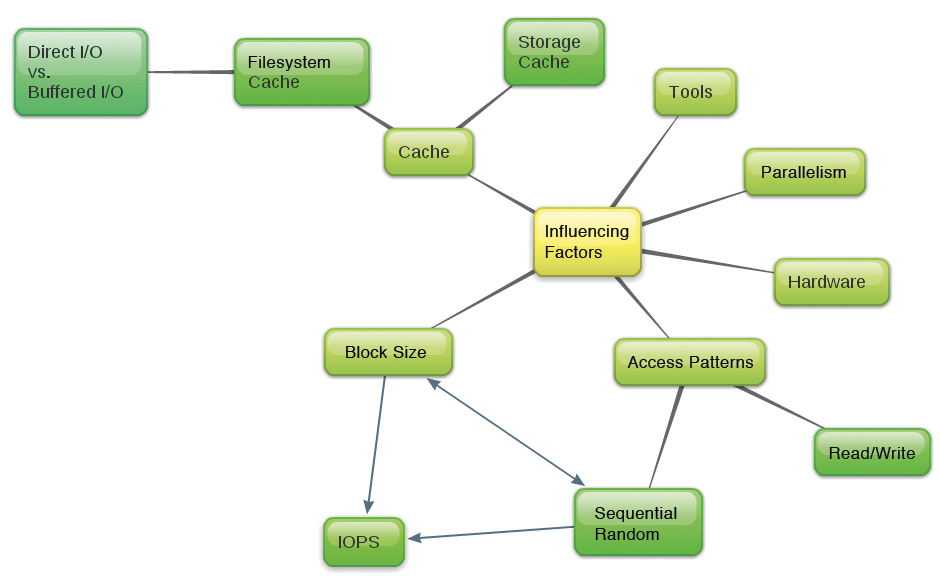
- Hardware
- Block size
- Access patterns (read/write portions and the portion of sequential and random access)
- Use of the various caches
- Benchmark tool used
- Parallelization of I/O operations
Storage hardware naturally determines the test results, but the performance of processors and RAM can also cause a bottleneck in a storage benchmark. This effect can never be entirely excluded when programming the benchmark tools, which is why caution is advisable in comparing I/O benchmark results run with different CPUs or RAM configurations.
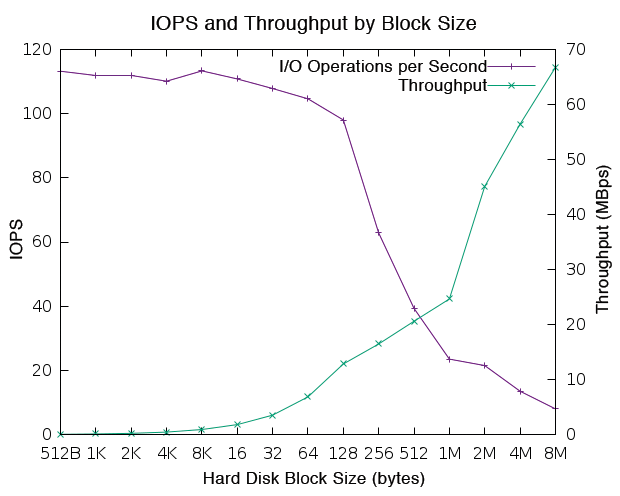
Block size determines the volume of data read or written by an I/O operation. Halving the block size with the same data flow leads to a doubling of the number of required I/O operation. Neighboring I/O operations are merged. Access within a block is always sequential; the random nature of access requests in case of very large block sizes is thus secondary. The measured values are then similar to those for sequential access.
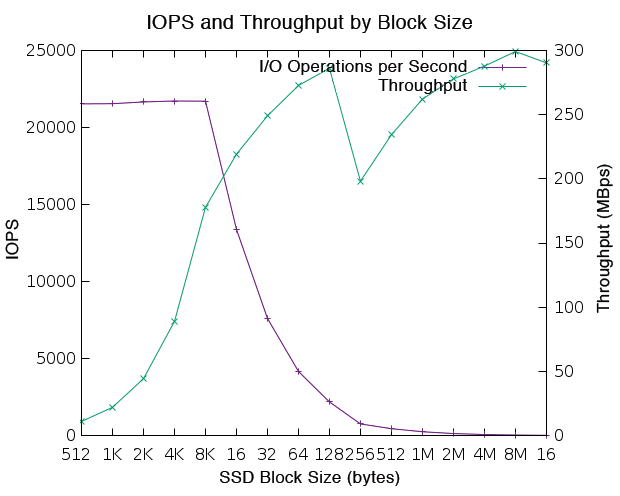
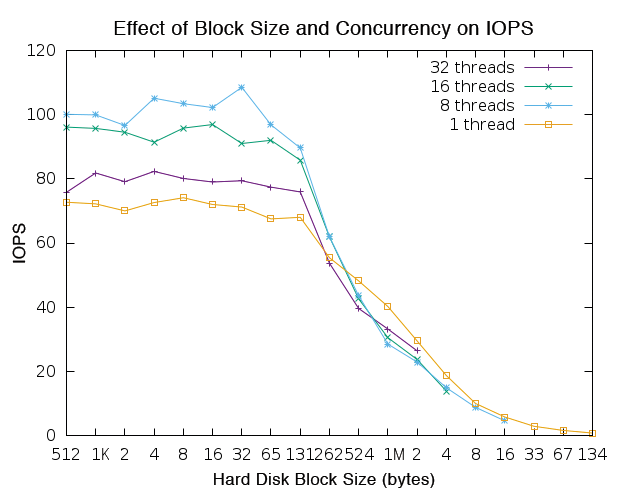
Each operation will cost a certain amount of overhead; therefore, the throughput results will be better for larger blocks. Figure 3 shows the throughput depending on block size for a hard disk. The statistics were created with the iops program, carrying out random reads. Figure 4 shows an SSD, which eliminates the seek time of the read head. The block size can be arbitrarily large – Linux limits it by the value in /sys/block/<device>/queue/max_sectors_kb.
Reading is generally faster than writing; however, you need to note the influence of caching. During reading, the storage and filesystem cache fill up, and repeated access is then faster. In operations, this is desirable, but when benchmarking, the history leads to measuring errors. During writes, the caches behave exactly the other way around: First, a write to the cache achieves high throughput, but later the content needs to be written out to disk. This results in an inevitable slump in performance and can also be observed in the benchmark.
Read-ahead access is another form of optimization for read operations. The speculative operations read more than requested, because the following block will probably be used next anyway. Elevator scheduling during writing will result in sectors reaching the medium in the optimized order.
If a filesystem cache exists, one speaks of buffered I/O; direct I/O bypasses the cache. With buffered I/O, data from the filesystem cache can be lost with a computer failure. With direct I/O, this cannot happen, but the effect on write performance is drastic and can be demonstrated with dd, as shown in Listing 1.
Listing 1: Buffered and Direct I/O
# dd of=file if=/dev/zero bs=512 count=1000000
1000000+0 records in
1000000+0 records out
512000000 bytes (512 MB) copied, 1.58155 s, 324 MB/s
# dd of=file if=/dev/zero bs=512 count=1000000 oflag=direct
1000000+0 records in
1000000+0 records out
512000000 bytes (512 MB) copied, 49.1424 s, 10.4 MB/s
If you want to empty the read and write cache for benchmark purposes, you can do so using:
sync; echo 3 > /proc/sys/vm/drop_caches
Sequential access is faster than random access, because access is always adjacent, allowing multiple operations of small block size to combine into a few operations of large block size in the filesystem cache. Also, the time needed to reposition the read head is eliminated. The admin can monitor merging of I/O blocks with iostat -x. This assumes the use of the filesystem cache.
In Listing 2, wrqm/s stands for write requests merged per second. The example shown here merges 259 write requests per second (w/s) to 28 write operations (wrqm/s).
Listing 2: Merging I/O
Device:    rrqm/s   wrqm/s     r/s     w/s    rMB/s    wMB/s  avgrq-sz  ...
sdb          0.00    28.00    1.00  259.00     0.00   119.29    939.69  ...
Parallelism
Multiple computers can access enterprise storage, and multiple threads can access an internal hard drive. Not every thread always reads; therefore, you will generally see higher CPU utilization and higher overall throughput initially on increasing the thread count. The more threads you have accessing the storage, the greater the overhead becomes, again reducing the cumulative output.
There is an optimal number of threads, as you can see in Figures 5 and 6. Depending on the application, you will be interested in the single-thread performance or the overall performance of the storage system. This contrast is particularly relevant in enterprise storage, where a storage area network (SAN) is deployed.
iops program.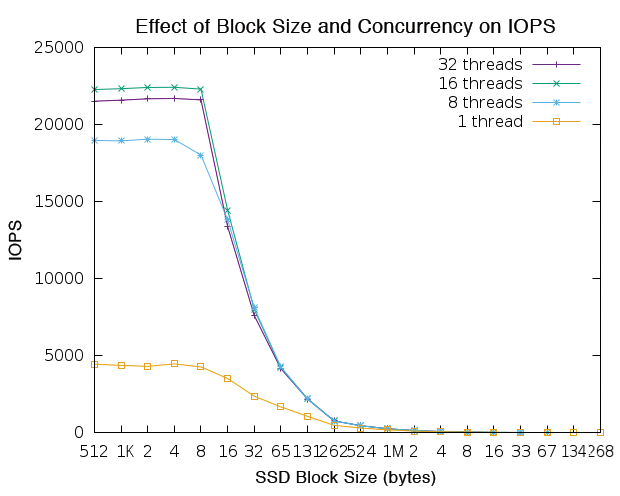
iops program.Benchmark tools themselves also have an effect on the measurement results. Unfortunately, different benchmark programs measure different values in identical scenarios. In the present test, the iops tool measured 20 percent more I/O operations per second than Iometer – given the same thread count and with 100 percent random read access in all cases. Additionally, random fluctuations occur in the measurement results, stemming from many influences – such as the status of programs running at the same time – which are not precisely repeatable every time.
The iops Program
The iops [1] program quickly and easily shows how many I/O operations per second a disk can cope with, depending on block size and concurrency. It reads random blocks, bypassing the filesystem. It can access a virtualized block device such as /dev/dm-0 or a physical block device such as /dev/sda.
iops is written in Python and is quickly installed:
cd /usr/local/bin
curl -O https://raw.githubusercontent.com/cxcv/iops/master/iops
chmod a+rx iops
In Listing 3, iops is running 32 threads on a slow hard disk; it reads random blocks here and doubles the block size step by step. For small blocks (512 bytes to 128KB), the number of possible operations remains almost constant, but the transfer rate doubles, paralleling the block size. This is due to the read-ahead behavior of the disk we tested – it always reads 128KB blocks, even if less data is requested.
Listing 3: IOPS on a Hard Disk
# iops /dev/sdb
/dev/sdb,   1.00 TB, 32 threads:
512   B blocks:   76.7 IO/s,  38.3 KiB/s (314.1 kbit/s)
   1 KiB blocks:   84.4 IO/s,  84.4 KiB/s (691.8 kbit/s)
   2 KiB blocks:   81.3 IO/s, 162.6 KiB/s (  1.3 Mbit/s)
   4 KiB blocks:   80.2 IO/s, 320.8 KiB/s (  2.6 Mbit/s)
   8 KiB blocks:   79.8 IO/s, 638.4 KiB/s (  5.2 Mbit/s)
  16 KiB blocks:   79.2 IO/s,   1.2 MiB/s ( 10.4 Mbit/s)
  32 KiB blocks:   81.8 IO/s,   2.6 MiB/s ( 21.4 Mbit/s)
  64 KiB blocks:   78.0 IO/s,   4.9 MiB/s ( 40.9 Mbit/s)
128 KiB blocks:   76.0 IO/s,   9.5 MiB/s ( 79.7 Mbit/s)
256 KiB blocks:   53.9 IO/s,  13.5 MiB/s (113.1 Mbit/s)
512 KiB blocks:   39.8 IO/s,  19.9 MiB/s (166.9 Mbit/s)
   1 MiB blocks:   33.3 IO/s,  33.3 MiB/s (279.0 Mbit/s)
   2 MiB blocks:   25.3 IO/s,  50.6 MiB/s (424.9 Mbit/s)
As the block size continues to grow, the transfer rate becomes increasingly important; a track change is only possible after fully reading the current block. For even larger blocks, as of about 2MB, the transfer rate finally becomes authoritative – the measurement has then reached the dimension of sequential reading.
Listing 4 repeats the test on an SSD. Again, you first see constant IOPS (from 512 bytes to 8KB) and a doubling of the transfer rate in line with the block size. However, the number of possible operations already drops from a block size of 8KB. The maximum transfer rate is reached at 64KB; the block size no longer affects the transfer rate from here on. Both of these examples are typical: SSD disks are usually faster in sequential access than magnetic hard drives, and they offer far faster random access.
Listing 4: IOPS on an SSD
# iops /dev/sda
/dev/sda, 120.03 GB, 32 threads:
512   B blocks: 21556.8 IO/s,  10.5 MiB/s ( 88.3 Mbit/s)
   1 KiB blocks: 21591.8 IO/s,  21.1 MiB/s (176.9 Mbit/s)
   2 KiB blocks: 21556.3 IO/s,  42.1 MiB/s (353.2 Mbit/s)
   4 KiB blocks: 21654.4 IO/s,  84.6 MiB/s (709.6 Mbit/s)
   8 KiB blocks: 21665.1 IO/s, 169.3 MiB/s (  1.4 Gbit/s)
  16 KiB blocks: 13364.2 IO/s, 208.8 MiB/s (  1.8 Gbit/s)
  32 KiB blocks:  7621.1 IO/s, 238.2 MiB/s (  2.0 Gbit/s)
  64 KiB blocks:  4162.3 IO/s, 260.1 MiB/s (  2.2 Gbit/s)
128 KiB blocks:  2176.5 IO/s, 272.1 MiB/s (  2.3 Gbit/s)
256 KiB blocks:   751.2 IO/s, 187.8 MiB/s (  1.6 Gbit/s)
 512 KiB blocks:   448.7 IO/s, 224.3 MiB/s (  1.9 Gbit/s)
   1 MiB blocks:   250.0 IO/s, 250.0 MiB/s (  2.1 Gbit/s)
   2 MiB blocks:   134.8 IO/s, 269.5 MiB/s (  2.3 Gbit/s)
   4 MiB blocks:    69.2 IO/s, 276.7 MiB/s (  2.3 Gbit/s)
   8 MiB blocks:    34.1 IO/s, 272.7 MiB/s (  2.3 Gbit/s)
   16 MiB blocks:   17.2 IO/s, 275.6 MiB/s (  2.3 Gbit/s)
The iometer Program
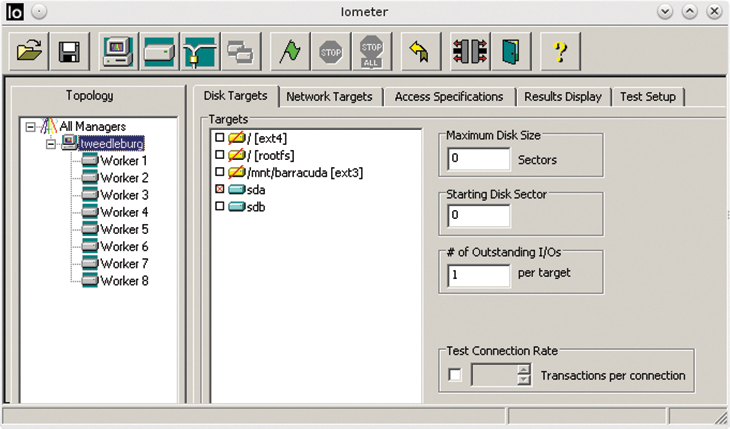
Iometer [2] is a graphical tool for testing disk and network I/O on one or more computers. The terminology takes some getting used to; for example, the term Manager is used for Computer, and Worker is used for Thread. Iometer can be used on Windows and Linux and provides a graphical front end, as shown in Figure 7.
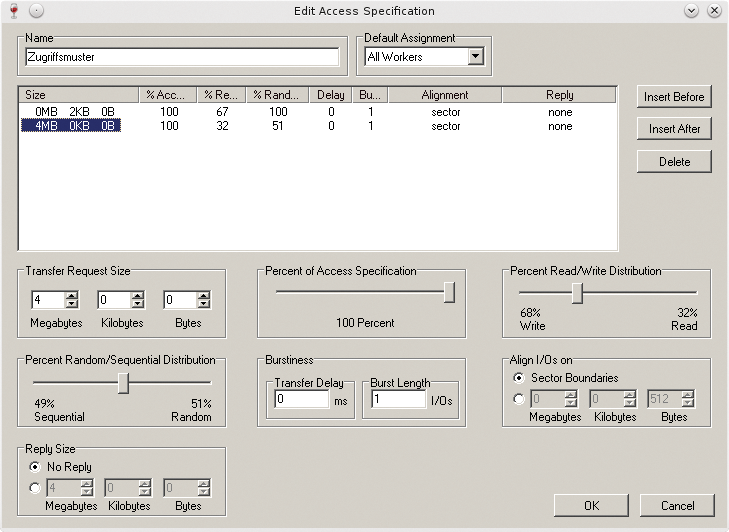
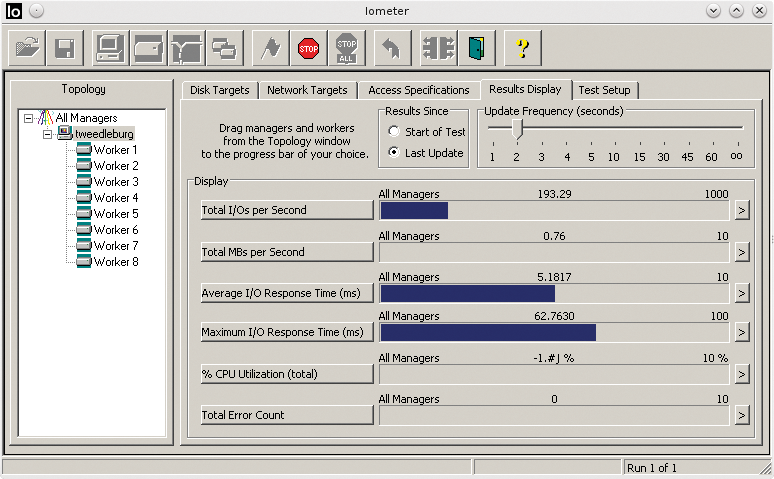
It can measure both random and sequential read and write access; the user can specify a percentile relationship for both. Figure 8 shows the process. Write tests should take place only on empty disks, because the filesystem is ignored and overwritten. The results displayed are comprehensive, as shown in Figure 9. The tool shows IOPS, throughput, latency, and CPU usage.
The dd Command
The dd command is a universal copying tool that is also suitable for benchmarks. The advantage of dd is that it works in batch mode, offers the choice between direct I/O and buffered I/O, and lets you select the block size. One disadvantage is that it does not provide any information about the number of I/O operations. You can, however, draw conclusions from the block size and throughput on the number of I/O operations. The following example shows how to use dd as a filesystem benchmark,
dd if=file of=/dev/null
or when bypassing the filesystem cache:
dd if=file iflag=direct of=/dev/null
You can even completely bypass the filesystem and access the disk directly:
dd if=/dev/sda of=/dev/null
The curse and blessing of dd is its universal orientation. It is not a dedicated benchmarking tool. Users are forced to think when running it. To illustrate how easily you can measure something other than what you believed to be measuring, just look at the following example. The command
dd if=/dev/sdb
resulted in a value of 44.2MBps on the machine used in our lab. If you conclude on this basis that the read speed of the second SCSI disk reaches this value with the default block, you will be disappointed by the following command
dd if=/dev/sdb of=/dev/null
which returns 103MBps – a reproducible difference of more than 100 percent. In reality, the first command measures how quickly the system can output data (e.g., zeros) at the command line. Simply redirecting the output to /dev/null corrects the results.
It's generally a good idea to sanity check all your results. Tests should run more than once to see if the results remain more or less constant and to detect caching effects at an early stage. A comparison with a real-world benchmark is always advisable. Users of synthetic benchmarks should copy a large file to determine the plausibility of a throughput measurement.
The iostat Command
Admins can best determine the performance limits of a system with benchmarks first and then use monitoring tools to check the extent to which they are utilized. The iostat command is a good choice here; it determines the I/O-specific key figures for the block layer. Listing 5 shows a typical call.
Listing 5: iostat Example
# iostat -xmt 1 /dev/sda
Linux 3.16.7-21-desktop (tweedleburg)   08/07/15        _x86_64_        (8 CPU)
08/07/15 17:25:13
avg-cpu:  %user   %nice  %system  %iowait  %steal   %idle
           1.40    0.00     0.54     1.66    0.00   96.39
Device:    rrqm/s   wrqm/s     r/s     w/s    rMB/s    wMB/s  avgrq-sz  avgqu-sz   await r_await w_await  svctm  %util
sda        393.19     2.17  137.48    2.73     2.11     0.07     31.82      0.32    2.32    2.18    8.94   0.10   1.46
In the listing, rMB/s and wMB/s specify the throughput the system achieves for read or write access, and r/s and w/s stand for read or write operations (IOPS) that are passed down to the SCSI layers. The await column, the average wait time for an I/O operation, which increases the service time, svctm, results in the latency. This is closely related to avgqu-sz, the average size of the request queue.
The %util column shows the I/O CPU load. The rrqm/s and wrqm/s columns are merged operations (read requests merged per second or write requests merged per second) requested by the overlying layers .
The average size of the I/O requests in the queue is given by avgrq-sz. You can use this to discover whether or not the desired block size also reaches storage (more precisely: the SCSI layers). The operating system tends to restrict the block size based on the /sys/block/sdb/queue/max_ sectors_kb setting. The block size is limited to 512KB in the following case:
# cat /sys/block/sdb/queue/max_sectors_kb
512
The maximum block size can be changed to 1MB using:
# echo "1024" > /sys/block/sdb/queue/max_sectors_kb
In practice, iostat supports versatile use. If complaints about slow response times correlate with large values of avgqu-sz, which are typically associated with high I/O await latency, the performance bottleneck is probably your storage. Purchasing more CPU power, as is typically possible in cloud-based systems, will not have the desired effect in this case.
Instead, you can explore whether the I/O requests are being broken up or hopped or are located near the limit of /sys/block/sdb/queue/max_sectors_kb. If this is the case, increasing the value might help. After all, a few large operations per second will provide higher throughput than many small operations. If this doesn't help, the measurement at least delivers a strong argument for investing in more powerful storage or a more powerful storage service.
The iostat command also supports statements on the extent to which storage is utilized in terms of throughput, IOPS, and latency. This allows predictions in the form of "If the number of users doubles and the users continue to consume the same amount of data, the storage will not be able to cope" or "The storage could achieve better throughput, but the sheer number of IOPS are slowing it down."
Other Tools
Other benchmark tools include fio (flexible I/O tester) [3], bonnie++ [4], and iozone [5]. Hdparm [6] determines hard disk parameters. Among other things, hdparm -tT/dev/sda can measure throughput for reading from the cache, which lets you draw conclusions on the bus width.
With respect to I/O, iostat can do everything vmstat does, which is why I don't cover vmstat here. Iotop helps you discover which processes are I/O-generating load. Also cat and cp from the Linux toolkit can be used for real-world benchmarks, such as for copying a large file. But, they only provide guidance for throughput.
Profiling
In most cases, you will not be planning systems on a greenfield site but will want to replace or optimize an existing system. The requirements are typically not formulated in technical terms (e.g., latency < 1ms, 2,000 IOPS) but reflect the user's perspective (e.g., make it faster).
Because the storage system is already in use, in this case, you can determine its load profile. Excellent tools are built into the operating system for this: iostat and blktrace. Iostat has already been introduced. The blktrace command not only reports the average size of I/O operations, it displays each operation separately with its size. Listing 6 contains an excerpt from the output generated by:
Listing 6: Excerpt from the Output of blktrace
8,0    0       22     0.000440106     0  C  WM 23230472 + 16 [0]
8,0    0        0     0.000443398     0  m   N cfq591A  / complete rqnoidle 0
8,0    0       23     0.000445173     0  C  WM 23230528 + 32 [0]
8,0    0        0     0.000447324     0  m   N cfq591A  / complete rqnoidle 0
8,0    0        0     0.000447822     0  m   N cfq schedule dispatch
8,0    0       24     3.376123574   351  A   W 10048816 + 8 <- (8,2) 7783728
8,0    0       25     3.376126942   351  Q   W 10048816 + 8 [btrfs-submit-1]
8,0    0       26     3.376136493   351  G   W 10048816 + 8 [btrfs-submit-1]
blktrace -d /dev/sda -o - | blkparse -i -
Values annotated with a plus sign (+) give you the block size of the operation: in this example 16, 32, and 8 sectors. This corresponds to 8192, 16384, and 4096 bytes, which allows you to determined which block sizes are really relevant – and the storage performance for these values can be measured immediately using iops. Blktrace shows much more, because it listens on the Linux I/O layer. Interesting here is that the opportunity to view the requested I/O block sizes and the distribution of read and write access.
The strace command shows whether the workload is requesting asynchronous or synchronous I/O. Async I/O is based on the principle that a request for a block of data is sent and that the program continues working before the answer has arrived. When the data block then arrives, the consuming application receives a signal and can respond. As a result, the application is less sensitive to high storage latency and depends more on the throughput.
Conclusions
I/O benchmarks have three main goals: Identifying the optimal settings to ensure the best possible application performance, evaluating storage to be able to purchase or lease the best storage environment, and identifying performance bottlenecks.
Evaluation of storage systems – whether in the cloud or in the data center – should never be isolated from the needs of the application. Depending on the application, storage optimized for throughput, latency, IOPS, or CPU should be chosen. Databases require low latency for their logfiles, and many IOPS for the data files. File servers need high throughput. For other applications, the requirements can be determined with programs like iostat, strace, and blktrace.
Once the requirements are known, the exact characteristics of the indicators can be tested using benchmarks. The performance of the I/O stack with or without the filesystem will be of interest, depending on the question. The iops and iometer tools bypass the filesystem.
Concentrating on the same metrics helps you investigate performance bottlenecks. Often, you will see a correlation between high latency, long request queues (measurable with iostat), and negative user perception. Even if the throughput is far from exhausted, IOPS can cause a bottleneck that slows down storage performance.
The write and read caches work in opposite directions. The caching effect causes performance measurements for the read cache first to increase within a few cycles and drop after a short time for write caches. Many caches work with read-ahead for read operations. The effects of I/O elevator scheduling are added for write operations. Neighboring operations are merged in the cache for both reads and writes. Random I/O requests reduce the probability that adjacent blocks are affected – and thus affect access performance. Random I/O operations are at a disadvantage on magnetic hard disks, more so than SSDs.
If you keep an eye on the key figures and the influencing factors, you turn to benchmark tools. In this article, we presented two storage benchmark tools in the form of iometer and iops. For pure filesystem benchmarks, however, fio, bonnie, or iozone are fine. Hdparm is useful for measuring the physical starting situation.
The blk-trace, strace, and iostat tools are useful for monitoring. Iostat gives a good overview of all the indicators, whereas blktrace listens in on individual operations. Strace can indicate whether async I/O is involved, which shifts the focus away from latency to throughput.
In the benchmark world, it's important to know that complexity causes many pitfalls. Only one thing helps: repeatedly questioning the plausibility of the measurement results.
