Monitoring with System Center 2012 R2 Operations Manager
Hall Monitor
In the System Center Suite, the Operations Manager is responsible for monitoring. Add-on Management Packs let you monitor a full range of services running on your Microsoft network. If you connect Operations Manager with the Virtual Machine Manager, you can even analyze Hyper-V environments.
Monitoring AD
Monitoring Active Directory (AD) services is essential for a functional and trouble-free AD environment. Management Packs in System Center 2012 R2 Operations Manager (SCOM) offer a powerful means of monitoring and maintaining your AD configuration. Operations Manager helps you monitor AD and respond in good time to warnings and error messages to resolve problems before they lead to major failures of the Active Directory environment.
To monitor an AD environment with SCOM, you must import the appropriate Management Pack, adapt it to your own uses, then permanently save your changes by creating a new Management Pack.
Management Pack for AD Monitoring
The AD Management Pack provides monitoring capabilities for an Active Directory environment. You can use the AD Management Pack to detect events from the application and system log of Windows Event Viewer, as well as from numerous other protocols belonging to various AD components. In addition to the overall state of AD, including the replication connections, the Management Pack monitors Active Directory sites, as well as the performance of the AD environment.
The AD Management Pack monitoring functions monitor domain controllers (DCs) from the perspective of the client.
All relevant monitoring functions are designed so the domain controllers behave like Active Directory clients that consume AD services on your network. The Management Pack provides a set of predefined Operations Manager rules, monitoring scripts, and reports designed specifically to monitor the performance and availability of domain controllers.
For example, Operations Manager monitors the services hosted on a domain controller, but it also performs further tests by generating synthetic transactions against Active Directory services, such as the Lightweight Directory Access Protocol (LDAP) and LDAP ping queries.
Additionally, the AD Management Pack performs other monitoring tasks, such as:
- Replication
- LDAP
- Domain controller Locator
- Trusts
- Netlogon service
- File Replication Service (FRS)
- Intersite Messaging Service
- Windows clocks
- Active Directory Web Services (ADWS)
- Active Directory Management Gateway Service
- Key Distribution Center (KDC)
- Service availability
- Performance data
In addition to monitoring, the Management Pack also provides reports on service availability and the state of Active Directory services, as well as tips on AD capacity planning.
Setting up Proxy Agents
An important prerequisite for correct monitoring using the AD Management Pack is the configuration of the Agent Proxy function [1] on all domain controllers.
If you enable the Agent Proxy in the Operations Manager Administration workspace on a domain controller that is managed by the Operations Manager agent, the system has the ability to detect the connection objects of other domain controllers. The Agent Proxy obtains information about parent entities by means of installed Operations Manager agents. This ability to pass information around the network means an Agent Proxy can discover information about other domains that are on the network but are managed by other domain controllers.
To enable the Agent Proxy function, start the Operations Manager console, navigate to the Device Management | Agent Managed node, right-click on the agent, and select Properties. In the Security tab, check the box labeled Allow this agent to act as a proxy and discover managed objects on other computers.
The Operations Manager Administration workspace can only enable on one computer at a time. If you need to enable the proxy agent on multiple computers at the same time, use an Operations Manager PowerShell command, such as the following, which enables the proxy agent on all systems installed with Operations Manager:
Get-SCOMAgent | where {$_.Proxying-Enabled.Value -eq $False} | Enable-SCOMAgentProxy
For security reasons, you should only enable the Agent Proxy function on systems where it is actually necessary. Other (non-trusted) systems monitored by the proxy agent could send fake events, performance data, and states to the Operations Manager after activation.
Monitoring Events on DCs
After you import the AD Management Pack and the necessary changes to reflect the conditions of the internal IT infrastructure, Operations Manager begins to write the data sent in by Operations Manager agents to its own separate database and to output alerts and notifications at the Administration workspace.
In the Monitoring workspace, you will find the individual monitoring elements provided by the Operations Manager Management Pack. The extent and nature of the information provided depends on the properties and functions of the Management Pack. The AD Management Pack provides the following information:
- DC Active Alerts
- DC events
- DC Performance Data
- DC State
- Client Monitoring
- Replication Monitoring
- Topology Views
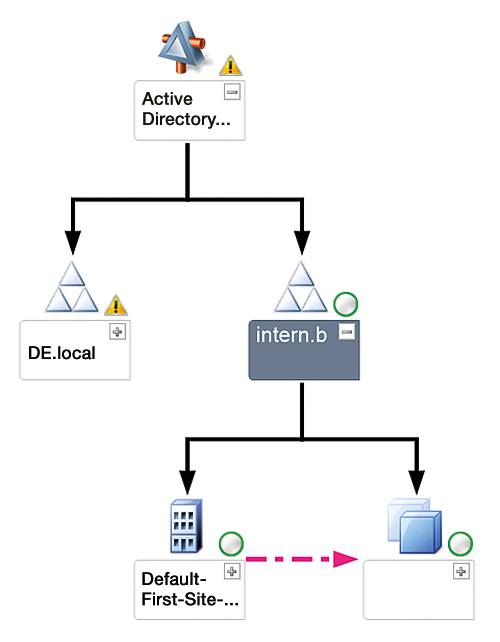
Some items of information, such as Topology Views (Figure 1), are broken down into further elements, such as the overview of AD Sites, Topology, and Connection Objects.

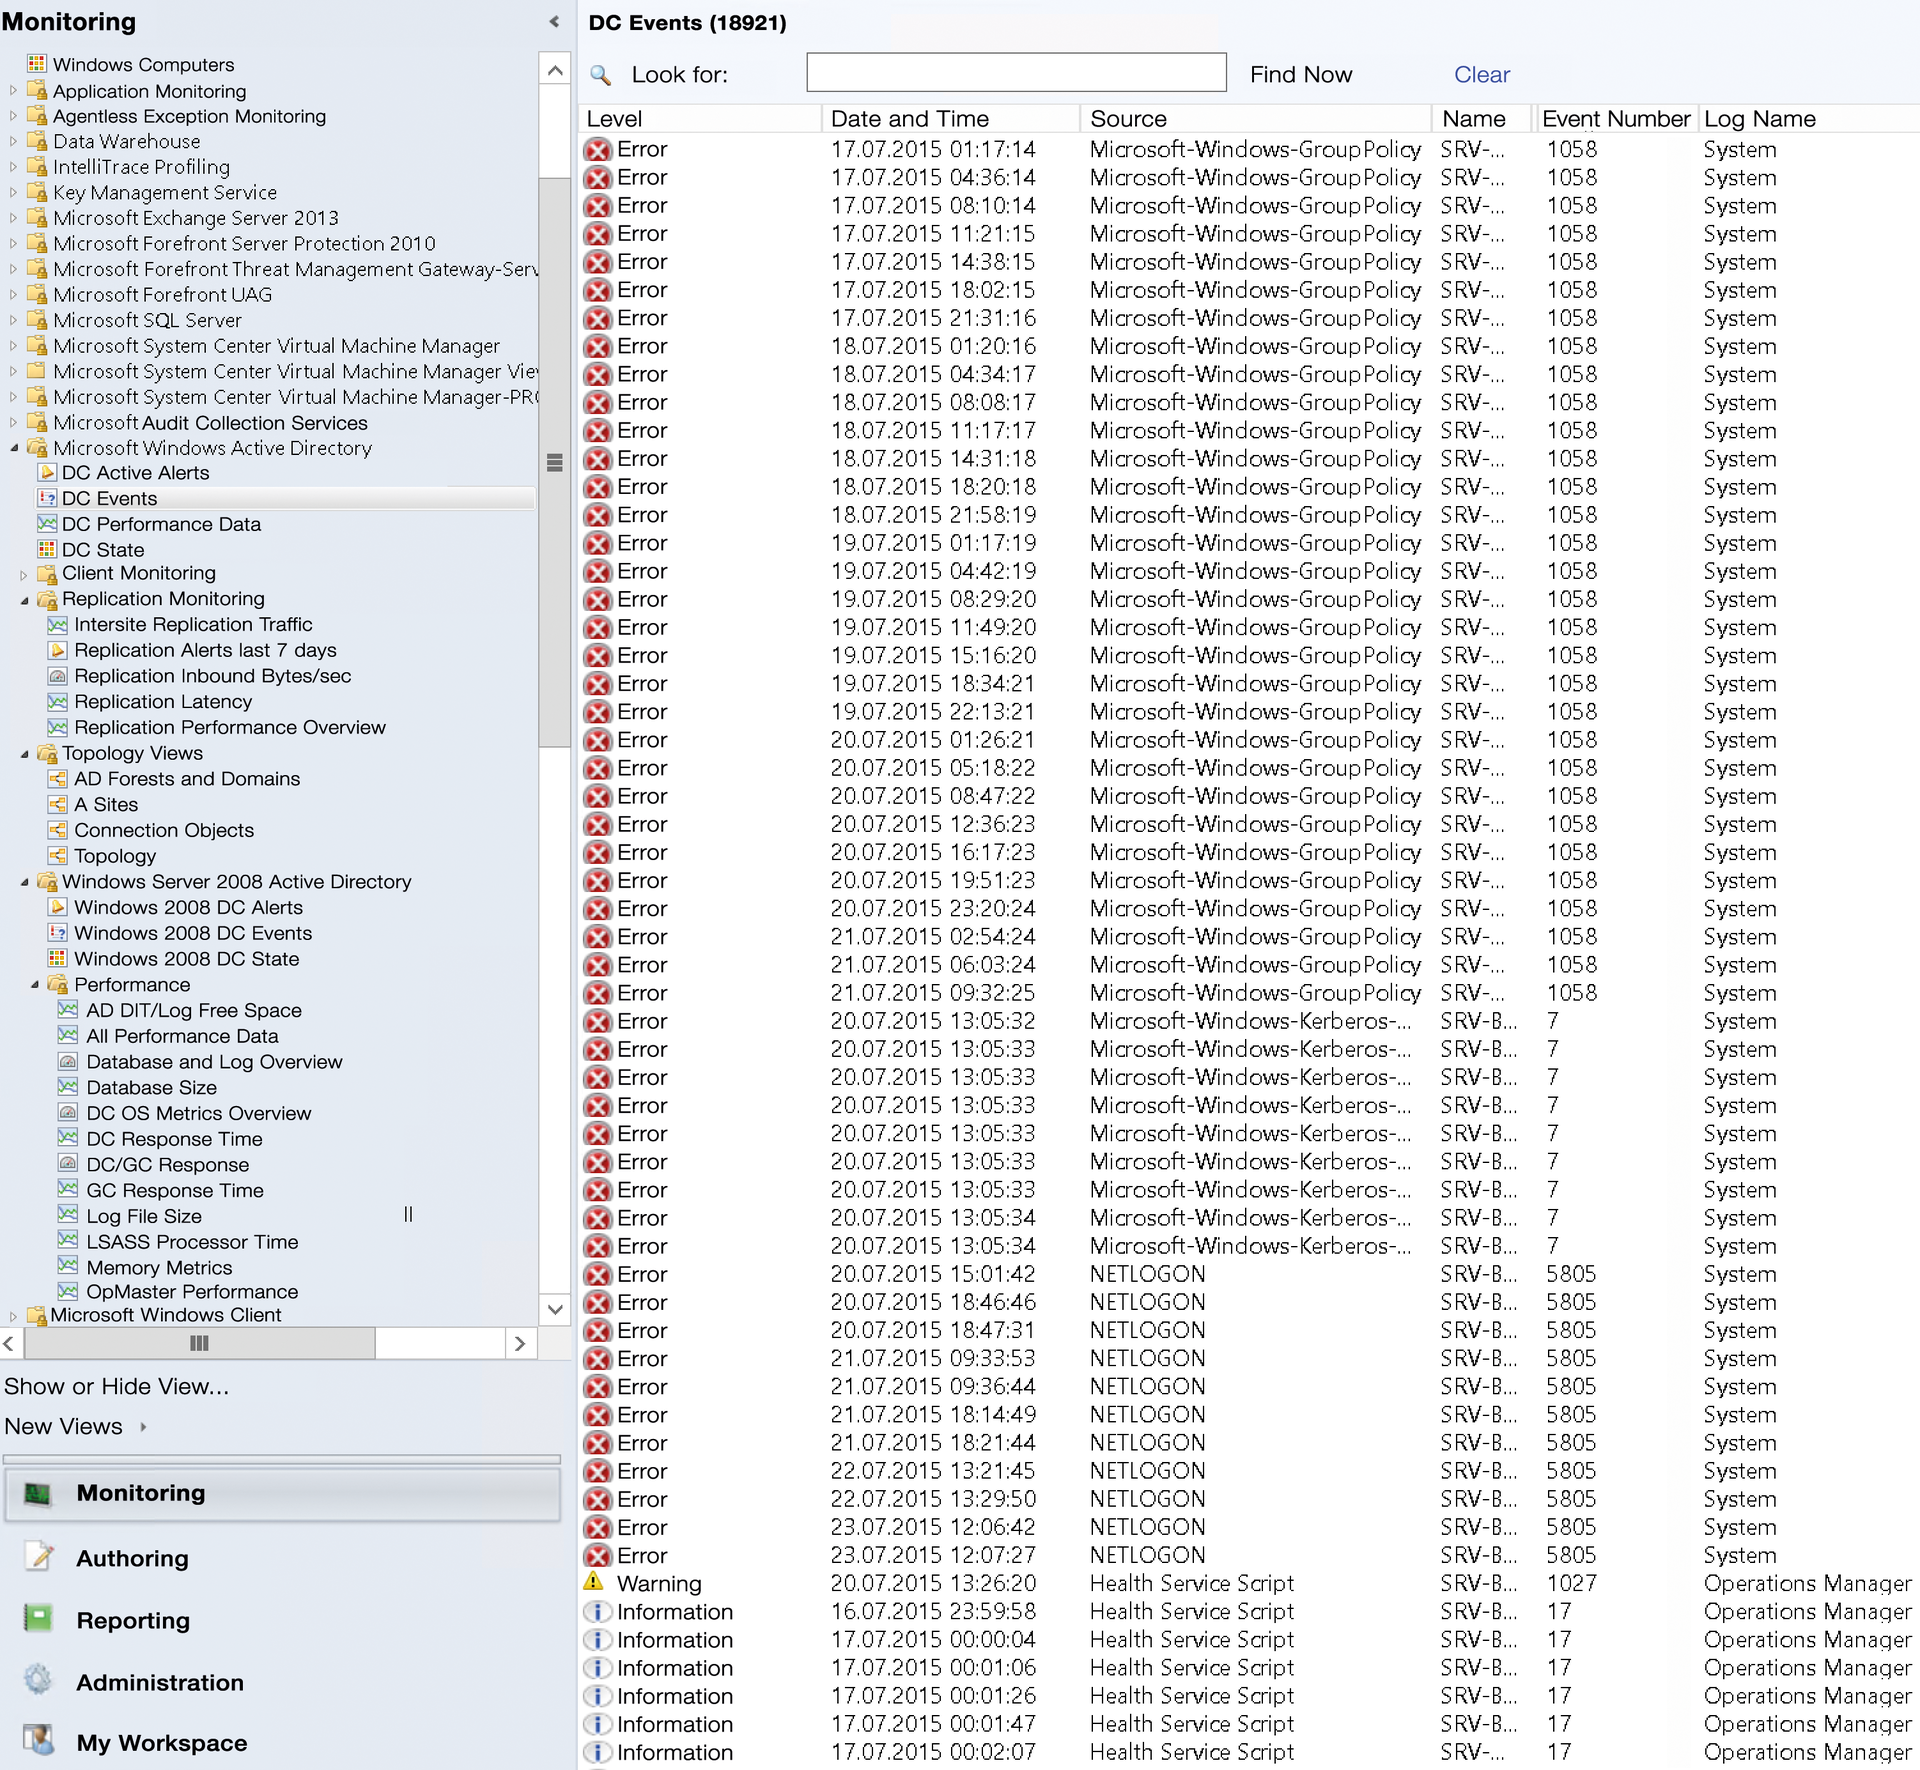
The information for DC Events shows all events relating to communication between the Operations Manager and the monitored resource – in this case, a domain controller (Figure 2). By right-clicking on the item, you can open the Alert View, State View, and Performance View via the context menu, or configure Overrides Summary View to disable rules for the object or class.

AD Replication Monitoring
One of the most common causes of Active Directory troubleshooting is replication problems between domain controllers. Because of AD replication technology and multimaster replication between domain controllers, problems can occur during AD replication that can be analyzed and resolved using a variety of troubleshooting options. Options include command-line tools such as Repadmin and DCDiag, as well as graphical programs such as the Active Directory Replication Status tool.
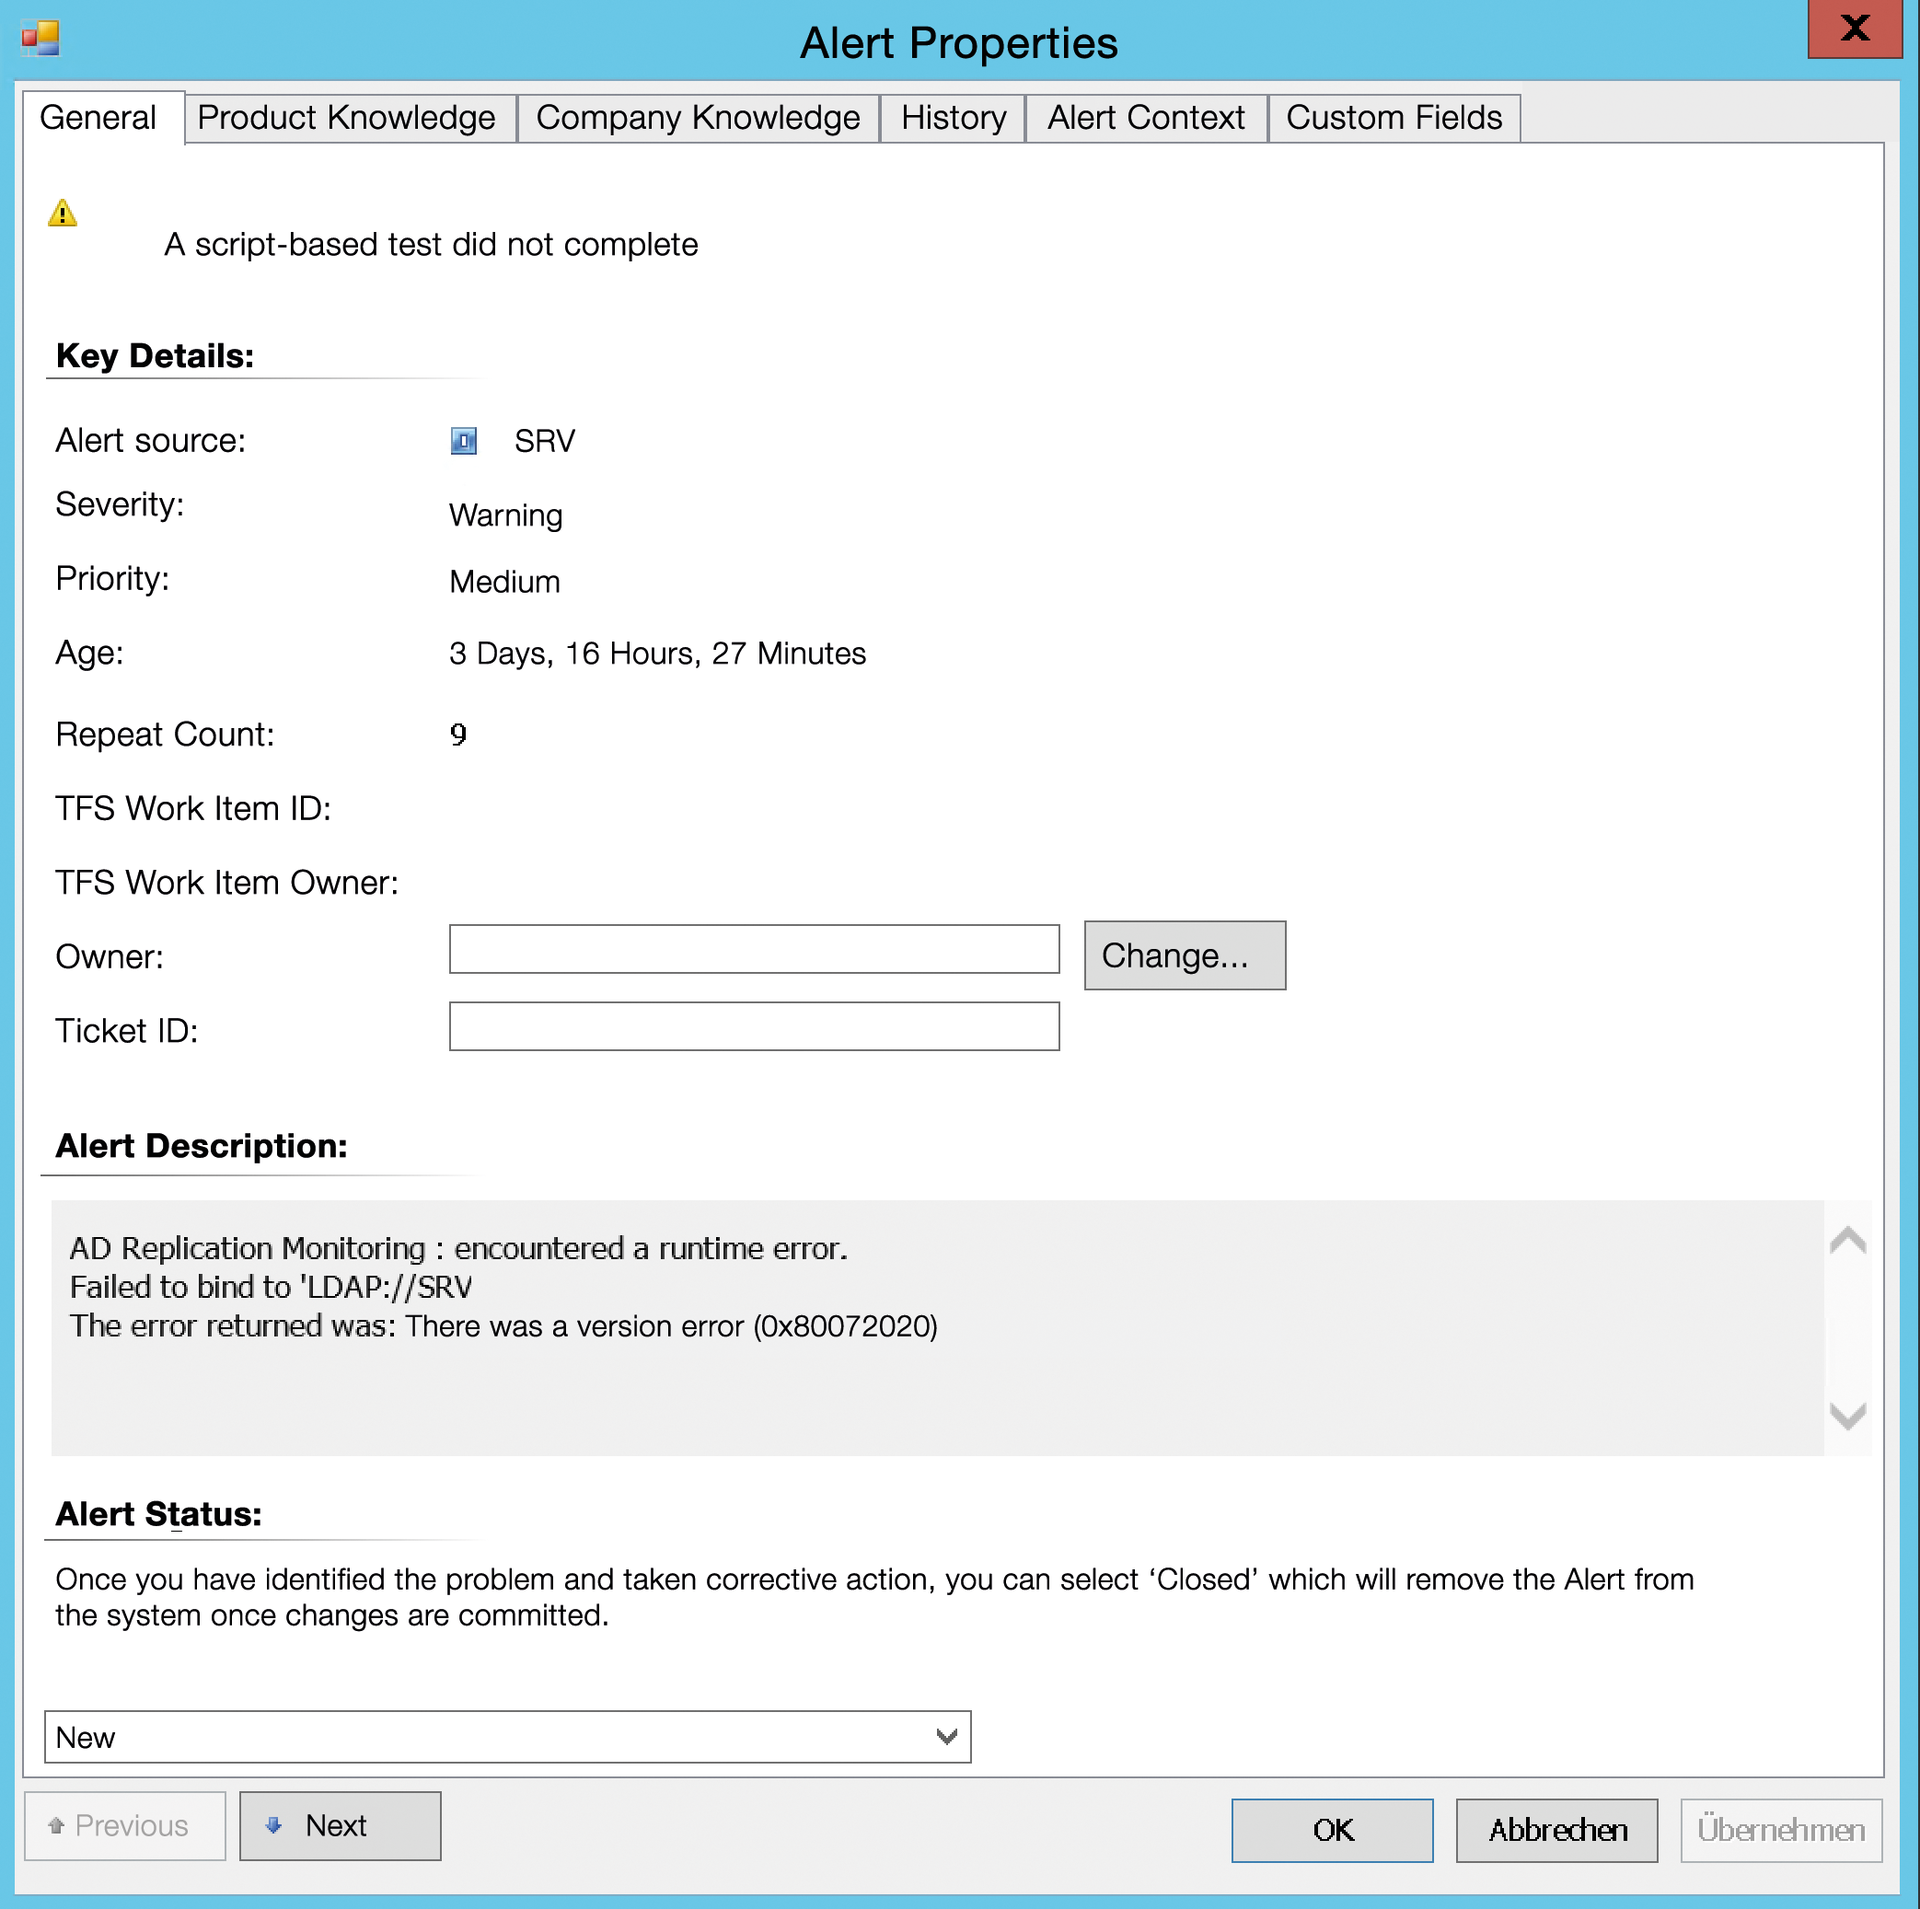
The Operations Manager Management Pack for Active Directory complements these programs and tools, adding specific views for replication events and performance metrics for replication performance. You can use this information, in addition to the information from numerous other utilities, to analyze and resolve replication problems quickly (Figure 3).

In the properties of the AD Management Pack, you will find a list of all the active alerts from DCs that are not automatically resolved or are resolved by an Operations Manager administrator. This list is where you will find the greatest level of detail about which DC is causing problems. Common error messages include requests to one of the operations master roles (FSMO – Flexible Single-Master Operations), which occurs for various reasons, such as maintenance on domain controllers or short-term unavailability because of network interruptions. You can use the Netdom.exe command-line utility to check which DCs are running the operations master roles. The
netdom query fsmo
command displays all operations master roles in the Active Directory forest, allowing you to check DC functionality.
The message The domain controller has been terminated is a good indicator of a DC that has shut down or restarted for maintenance purposes. Operations Manager detects this condition because the event log service has stopped, which is not possible under normal circumstances through administrator intervention.
The information element Active alerts for domain controller lists all active alerts for all monitored DCs. This list must be given special attention as these active warnings may be genuine indicators of limited performance or functionality of the AD. You can also link automatic remediation actions to events. For instance, you can associate an event with restarting Windows services or applications.
In the Alert Properties dialog for the active alert, you can click on the Product Knowledge and Company Knowledge tabs to see if the manufacturer of the Management Pack already provides solutions for the alert event, or whether internal knowledge exists to solve the problem. The History tab gives you an overview of the development of the event in the past.
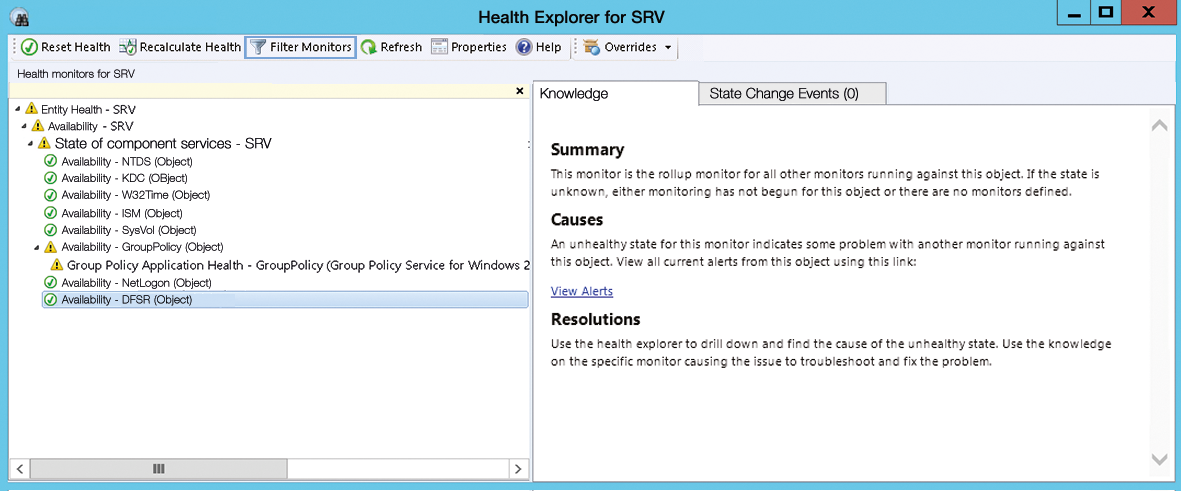
If this information is not sufficient, the Health Explorer in the Operations Manager Administration workspace provides more detailed information (Figure 4). You access this information by navigating the tree in the Health Explorer and displaying the information for each event. After fixing the problem, you can set the resolution state and close the alert. If you need to work on the monitored resource – in this case the domain controller – to solve the problem, you need to switch the resource to Maintenance mode. After completing the work and successfully resolving the problem, you can switch the resource out of Maintenance mode; Operations Manager then again starts monitoring the resource.

For comprehensive monitoring of the Active Directory, import Management Packs for DNS, DHCP, and the distributed filesystem and adapt them to the special features of your IT infrastructure. Because Active Directory greatly depends on correct operation of DNS and other services (e.g., FRS, DFS, DHCP) and because many more use AD, it is important to monitor all of these subsystems.
Monitoring Exchange
Microsoft Exchange Server is a complex system that requires time-consuming troubleshooting and repairs because of its dependence on other Windows subsystems, such as Active Directory and the domain name service. For many versions, Exchange Server has provided integrated problem-solving wizards. The system is even capable of restarting its own individual Exchange components in case of failure. The examples for monitoring Exchange servers is based on Exchange 2013.
Managed Availability in Exchange Server 2013
In Exchange Server 2013, Microsoft made some changes to the architecture. One of the major changes was the new Managed Availability feature. All Exchange 2013 components have built-in monitors that identify problems and try to restore service availability automatically in case of failure. The Exchange 2013 Management Pack (EXMP) uses these functions. All problems that cannot be solved automatically by the managed availability feature are stored as warnings in EXMP. Every component in Exchange 2013 has a special group of tests, monitors, and response services for self monitoring. These collections of tests and monitors are known as integrity records.
A series of tests could, for example, collect data on different aspects of the Microsoft ActiveSync service for mobile communications. This data is processed by a particular group of monitors that triggers the appropriate response services to resolve problems detected by the ActiveSync service. Together, these components form the ActiveSync health set.
Importing EXMP
Before you import the current EXMP, you should also import the current Windows Server Management Pack (WSMP) on servers running Microsoft Exchange. WSMP monitors a series of parameters in the Windows Server environment that are also important for the performance and stability of Exchange 2013. Exchange also uses Windows subsystems such as failover clustering if you use the Database Availability Group (DAG), and it relies heavily on the Internet Information Service (IIS) for numerous Client Access Server (CAS) role tasks. A Management Pack for Microsoft IIS is available as well, and you should consider importing it.
EXMP is available for download from the Microsoft website, but you can also download it through the management catalog. For the files contained in the Management Pack, see Table 1.
Tabelle 1: EXMP Components
|
File |
Management Pack Description |
|---|---|
|
|
Discovers the installed Exchange Server 2013 components and provides monitoring capabilities, as well as overviews of performance data. |
|
|
Enables Operations Manager to use the Exchange 2013 monitoring logic interface to provide reporting features. The Management Pack does not implement any monitoring logic. |
|
|
Implements the visualization capabilities of Operations Manager for Exchange in the form of Operations Manager widgets and dashboards. |
EXMP automatically discovers the following Exchange components:
- Exchange 2013 Server
- Distributed applications: Exchange 2013 organizations, Exchange 2013 AD sites, Exchange 2013 DAGs
- Health Groups: Exchange 2013 health sets (Customer Touch Points, Key Dependencies, Server Components, Service Components)
- Exchange 2013 server components: IIS application pools, Windows services, mailbox database copies (DAGs)
Exchange components are discovered on every Windows server running the Monitoring Agent and installed Exchange services. The Management Pack allows you to monitor the health status of the entire Exchange Server environment, as well as Windows services on the Exchange servers after the import.
To import EXMP, go to the Administration workspace in the Operations Manager console. After you import the Management Pack, create a copy and configure any customizations, such as overrides. To set up the proxy agent required for Exchange, use the same procedure as for configuring AD proxy agents.
Active Alarms
After installing the Operations Manager agent and importing EXMP, information is immediately written to the Operations Manager database and displayed in the management console under Microsoft Exchange Server 2013. In the Monitoring workspace, you can see all the alarms that occurred on the monitored systems at the top, assuming you have not confirmed these alarms and they have not been resolved automatically. The alarm overview gives you a good overview of the state of the Exchange environment.
Once you have determined an Exchange-relevant alert in the Operations Manager console, the next step is to review the Exchange organization's health state. Double-clicking on a alarm gives you detailed information in the Health Explorer and can trigger other actions.
With the help of a graphical representation of the Exchange organization and the associated components, you can quickly navigate to the point where the Operations Manager has detected a problem in the Exchange configuration. You should use the information under Organization Health as your first port of call for existing Exchange problems, because it shows information about the state of Active Directory and other subsystems. The chart of the organization configuration lists the individual Exchange servers and their roles and graphically shows you which Exchange roles are experiencing problems.
Finding Sick Servers
To determine which server is causing problems, you can use the Server Health option in the management console. You will find an overview of the health state of the individual Exchange servers in the Topology Views, where you can select a server and drill down in the tree structure to the identified problem, and then search for a solution in the product knowledge base or your internal corporate knowledge database.
The Exchange Server 2013 Management Pack provides a view of all active alerts, that is, all alerts still not automatically resolved or resolved by Operations Manager administrators. Right-click to open the Health Explorer in the context menu and display the entity health of the component. Very often, the component will be monitored by the Managed Availability service in Exchange 2013. A more common error occurs on Outlook Web Access (OWA) logon to a client access server. To find solutions for the problems, you need to check the trace logs on the client access server. These logs, which are located by default in the installation directory of the Exchange Server below Logging\Monitoring\OWA, provide information about the cause of the error.
Double-clicking on the server opens the Health Explorer window, in which you can determine the service component that has a failed state. Clicking on the component displays the information for its health record. You can check a component's state using Operations Manager PowerShell to verify the OWA proxy component:
Get-ServerHealth Server1.contoso.com | ?{$_.HealthSetName
-eq "OWA.Proxy"}
If the result indicates, for example, a problem with the IIS application pool for OWA, you can use the following command to restart the test associated with the Managed Availability Exchange 2013 monitor:
Invoke-MonitoringProbe OWA.Proxy\OWAProxyTestProbe -Server Server1.contoso.com | Format-List
Exchange 2013 uses the Managed Availability function to monitor hundreds of Exchange functions. The recovery information in the Operations Manager console shows details for resolving the problem. In this case, you need to restart MSExchangeOWAAppPool. You can restart MSExchangeOWAAppPool using the IIS management console or the appcmd command-line program. To restart MSExchangeOWAAppPool with AppCmd, type
Appcmd recycle APPPOOL MSExchange-OWAAppPool
and recheck the status of the OWA component. If the problem has been fixed, the server state will change on the Operations Manager console.
Monitoring Hyper-V
Against the background of its cloud initiative, Microsoft provides the Operations Manager Management Pack for Windows Server 2012 R2 and its Hyper-V role, thus giving admins the ability to monitor the overall performance of the virtualization environment and keep track of the configuration with numerous reports.
The Hyper-V Management Pack (HVMP) is designed to monitor the health state of a virtualization environment holistically. With optional integration between Operations Manager and Virtual Machine Manager (VMM), you tie in the two platforms for better integration.
HVMP monitors the Hyper-V role on a Windows Server running Windows Server 2012 R2 and supports System Center 2012 R2 Operations Manager and failover clusters, although not agentless monitoring.
HVMP for Operations Manager requires the following Management Packs:
- System Center 2012 R2 Operations Manager
- Microsoft.Windows.HyperV.Library
- Microsoft.Windows.Library
- System.Library
- Microsoft.SystemCenter.Library
- Microsoft.Windows.HyperV.2012.Discovery
- Microsoft.Windows.Server.Library
- Microsoft.Windows.Server.2012.R2.Discovery
- Microsoft.Windows.HyperV.2012.R2.Monitoring
- System.Health.Library
- System.Performance.Library
- System.Virtualization.Library
The download package for HVMP contains the following files:
Microsoft.Windows.HyperV.2012.R2.Discovery.mpMicrosoft.Windows.HyperV.2012.R2.Monitoring.mpMicrosoft.Windows.HyperV.Library.mp-
EULA.rtf(Microsoft End User License Agreement) -
OpsMgr_MP_WS_HyperV.docx(Management Pack Guide)
In the Word document included in the download you will find more important information about installing and configuring the Management Pack.
Hyper-V Management Pack
HVMP for the System Center Operations Manager provides numerous monitoring and reporting capabilities (Table 2). As usual, you need to import the System Center 2012 R2 Management Pack [2] into the Operations Manager console after downloading. As with most other Management Packs, the recommendation again applies to create a copy then configure other customizations, such as overrides. After you import the Management Pack, acquisition of all relevant Hyper-V server data then starts using the agent. Again, the data is stored in the Operations Manager database, and insights are provided courtesy of the Operations Manager console.
Tabelle 2: HVMP Monitoring and Reporting
|
Monitoring Scenario |
Description |
Associated Rules and Monitors |
|---|---|---|
|
Basic Hyper-V |
Monitor critical Hyper-V components, such as network and storage |
Monitor: Virtual machine management serviceRule: Transmitted network throughputRule: Received network throughput |
|
Virtual machines and associated components |
Monitor critical system events |
Monitor: Free space on the virtual hard disk |
|
RemoteFX configuration |
Monitor systems that use RemoteFX |
Monitor: Hyper-V 2012 RemoteFX-capable GPUMonitor: Server GPU configurationMonitor: Hyper-V 2012 RemoteFX virtual machine screen resolution |
|
Hyper-V replica configuration |
Monitor the configuration and availability of Hyper-V replica technology |
Monitor: Hyper-V 2012 Replica Network ListenerMonitor: Hyper-V 2012 Replica Suspended StateMonitor: Hyper-V 2012 Replication Resync Required StateMonitor: Hyper-V 2012 Replication Not StartedMonitor: Hyper-V 2012 Replica Broker Configuration |
The Host Health Dashboard in the Operations Manager console is used to display the integrity of the monitored Hyper-V hosts. The display shows the active host alerts in addition to the host state. If such a warning appears, you can click on it for in-depth information.
With the release of System Center 2012 R2 Virtual Machine Manager Update Rollup 3, Microsoft has provided new Operations Manager VMM resource virtualization packs [3] that give admins a new dashboard view of all Hyper-V servers managed by System Center Virtual Machine Manager (SCVMM). The dashboard (Figure 5) displays the overall status of all Hyper-V servers, their properties, and performance counters. You will benefit from a view of all virtual machines identified, including the status of each machine based on the traffic light principle (red, amber, green).

SCOM and SCVMM
You can combine System Center 2012 R2 Virtual Machine Manager with System Center 2012 R2 Operations Manager to monitor the integrity and availability of virtual machines managed by SCVMM and Hyper-V hosts [4]. You can also monitor the integrity and availability of SCVMM Management Server, the VMM database server, and the library server and visualize the virtualized environment using the Operations Manager console.
In this integrated scenario, the VMM Management Packs for Operations Manager are imported automatically; Operations Manager provides performance and resource optimization (PRO), integrates a maintenance mode, and offers support for SAAS (SQL Server Analysis Services) and related reporting. Before you can open a connection between SCOM and SCVMM, you need to create the following prerequisites:
- TCP port 5724 between VMM and Operations Manager must be allowed on the Windows Firewall.
- The Operations Manager console must be installed on the VMM server.
- The Operations Manager Agent must be installed on the SCVMM management server and on all Hyper-V hosts that are managed by SCVMM.
- For each managed Hyper-V and SCVMM host, the Agent Proxy feature must be enabled in Operations Manager.
You also need to import the following Management Packs on the Operations Manager server:
- Microsoft Windows Server Internet Information Services 2003
- Windows Server 2008 operating system (discovery)
- Windows Server operating system library
- Windows Server 2008 with Internet Information Services 7
- Windows Server Internet Information Services library
- SQL Server Core library
Then, integration of SCVMM and SCOM [5] is handled by starting the SCVMM management console on the Virtual Machine Manager server. Navigate to Settings | System Center Settings and then launch the wizard in the Operations Manager Server settings. During the setup, you are prompted for administrative permissions to access Operations Manager. After integration, the connection status icon should appear in green.
The SCOM management console now displays a variety of Management Packs, including a PRO Management Pack. To check whether PRO integration has been set up successfully, you can click the Test PRO button in the SCVMM management console's Operations Manager Settings dialog. The SCVMM management console opens a new window with a PRO status message. The PRO diagnostic warning is automatically resolved by the SCVMM and only serves to test the connection between the VMM and Operations Manager.
In addition to numerous charts and diagnostic views for managed Hyper-V systems, SCOM also offers a chart view of all systems integrated with SCVMM. In the chart view, you can navigate through the VMM infrastructure, display all the installed systems and components, select the component with a problem, and collect more information for troubleshooting and remedial action.
Thanks to the integration of SCVMM in SCOM, the health state of all virtual machines is now monitored. In the Virtual Machine Manager Management Pack, you are given an overview of the integration status of virtual machines below the Managed Resources/Virtual Machine Manager Server Health folder. In the status display for the virtual machines, you are given an overview of the VM status.
A common reason for integrity constraints messages is missing: non-installed or disabled components of the Hyper-V Integration Services. When you open the Health Explorer in the Operations Manager console, you are shown the entity health status of the virtual machine configuration with warnings, and you will see a notice that the virtual guest service is not installed or not enabled.
Conclusions
System Center 2012 R2 Operations Manager offers comprehensive monitoring of physical and virtualized environments, as well as application servers such as Exchange. Using a variety of dashboard and health views, administrators can gain a comprehensive overview. If you are using SCVMM, it is a good idea to import the System Center Virtual Machine Manager Management Pack to provide a more accurate overview of the configuration and performance of the Hyper-V environment.
