
Implementing custom security frameworks with Bro
Don't Hack Me Bro
Bro [1] is high-quality security monitoring tool designed to discover and analyze traffic trends on your network. Bro provides in-depth analysis of network traffic without limiting itself to traditional signature-based approaches. I first heard about the Bro network security monitoring framework when a consultant friend of mine talked about melding the world of big data and security together. My friend believed that traditional signature-based intrusion detection and monitoring simply wasn't enough to ensure a secure network.
The problem with networks is that, because of the increased number of devices, services, and tools used today, it's easy for attackers to enter networks in many different ways. Ransomware, botnets, malware, and remote control tools are readily available. Social engineering is especially prevalent now. Traditional intrusion detection and perimeter security tools just aren't up to the task.
Traditional monitoring tools are also having a hard time catching all of the anomalies. Bro, however, takes a different approach. The Bro framework is designed to monitor traffic on any layer. The default focus is on application layer traffic, but you can train Bro on any layer of the OSI stack. Bro is not really signature-based in its approach; it reviews traffic and looks for anomalous patterns. However, Bro also looks for similarities. It is ideal for setting baselines. Like many projects, Bro offers extensive commercial support.
Understanding Bro
The Bro application has three elements or layers:
- Monitoring engine: Software that listens to a network segment and reviews network traffic. This monitoring is similar to what Snort, Ntop, and other tools do. The engine also includes the event handler, which is designed to identify traffic and then act according to its configuration files.
- Policies: Files that determine how Bro will search the network. In addition to the monitoring engine, these policies are central to Bro's more novel approach to monitoring trends rather than focusing on known signatures.
- Logging engine: A component that organizes the information Bro captures.
With so many security projects in the open source/Linux space (see the box titled "Event Monitoring Tools") it is difficult to get excited about the latest and greatest software project. But Bro is a bit different. It's designed to fit a specific set of needs. Bro also happens to have been created at an appropriate time: It lets the user monitor events and then sift through them to find actionable information, not just data.
In today's security environment, most of my clients are asking for three things:
- Long-term attack analysis: It's not enough these days for IT professionals to set up real-time alerts of short-term scans. We all know that hackers are spending weeks and months surveilling and enumerating systems. Therefore, it's vital that today's security workers spend considerable time creating solutions that catch long-term attacks.
- An understanding of the unexpected places where the attackers are hitting them: Remember that old Monty Python skit where the folks storm in and yell, "No one expects the Spanish Inquisition?" CIOs and CISOs everywhere keep experiencing the hacker version of that joke; only, the results aren't so funny.
- Visualization: Business and IT professionals want easy-to-read representations of complex data.
Bro is really good at long-term attack analysis and understanding unexpected attacks; with a little help from its friends, it can also start you on the path to better visualization.
Installing Bro
It's best to install Bro from source. Although RPM and DEB binary packages are available, I have found they often don't work at all, or else they are missing some of the necessary software. The Kali Live Linux distro, a popular tool for penetration testing, comes with Bro installed by default, but I've found the Kali version doesn't work very well, either. You could try your luck, and your mileage may vary when it comes to the ready-made installation binaries that exist out there, but I know for a fact the source code installs on my Ubuntu 16.04 and Linux Mint systems.
The latest, stable version of Bro is 2.4.1. This latest version is the best documented version, and it works quite well. For those of you who have more intrepid natures, the 2.5 beta is available at the Bro website. I'll be sticking with 2.4.1 for this article.
Note: If you want to use Bro on a switched network, you will need to position Bro on a switch that allows your Linux system to monitor the entire network.
Start by installing the required dependencies. The dependencies, which are listed at the Bro website [6], include libpcap, OpenSSL, the BIND8 library, libz, Bash, and Python. Installing from source requires additional dependencies, including Swig, Bison, and Flex. I found that each of these dependencies was quite easy to install.
Once your system is ready, issue the following commands to install and compile Bro:
$ sudo apt-get install zlib
$ sudo apt-get install zlib-headers
$ sudo apt-get install cmake make gcc g++ bison libpcap-dev libssl-dev python-dev swig zlib1g-dev
$ cd Bro-2.4.1/
$ ./configure -prefix=/nsm/Bro
$ make
$ sudo make install
$ export PATH=/nsm/Bro/bin/:$PATH
If the PATH export doesn't work, you can also edit the /etc/environment file so that all new terminal instances can readily find where Bro is located.
Configuring Bro
Bro supports a pair of different approaches for interacting with the system:
- The
/etc/init.d/brocommand starts scripts that you can use to directly stop, start, and restart the application. - The
broctl(BroControl) command starts an interactive shell. You will live in this shell and use it to configure and manage the entire framework. With this command, you can activate interfaces, view statistics, and change the way Bro operates. Don't worry – it's a pretty intuitive environment.
Bro uses nodes to control its framework. A node basically ties Bro's detection engine and rules to a particular interface and to a role. You configure a node in the /nsm/bro/etc/node.cfg file.
Another way to view a node is that it denotes a particular sniffing interface; you can configure multiple interfaces. It is possible to configure the following node types:
- Standalone: the system runs as a single node. If you are configuring a Standalone node, then make sure all other node types are commented out.
- Manager: the most powerful configuration after Standalone – used by those who not only want to view packets but also make changes to how Bro operates.
- Worker: For nodes that only view statistics.
Look for the Bro configuration and logfiles in the /nsm/Bro/etc/ directory – not the /etc/ directory. The files include:
-
node.cfg: where you create nodes. -
networks.cfg: where you specify the network to monitor. -
broctl.cfg: allows you to configure mailing options. -
/nsm/bro/share/bro/policy/protocols: scripts configuration files. -
/nsm/logs/: logfiles.
Start by configuring Bro so that it knows how to behave and knows the network. The node.cfg file determines how Bro will act. The networks.cfg file simply should include your current network, as well as any networks you want Bro to audit.
When editing node.cfg, it is possible to configure different nodes for the same interface. For the purposes of this article, I'll run Bro as a Standalone node. The first step is to configure the /nsm/bro/etc/node.cfg file (see Figure 1).
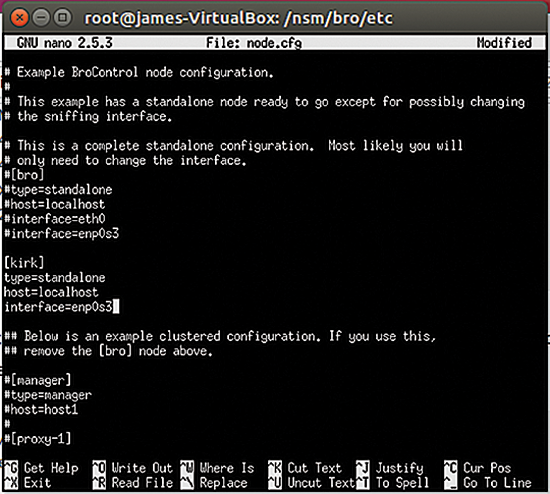
node.cfg file.The default value is bro, but I decided to use kirk instead. Notice that the kirk node lists my own system, sets it up as a standalone system, and then specifies the interface. In this example, I'm using a virtualized Ubuntu system on a new-ish Ubuntu host, so the interface name is enp0s3, rather than something standard such as eth0 or wlan0.
Once you have configured and saved your changes, you can then run broctrl as root to enter the interactive session. Once you enter the command
$ sudo -i broctl
you'll be placed into the interactive session, as shown in Figure 2.

From this session window, you can restart Bro to re-read any changes you've made in your configuration. You can also issue commands such as:
-
status: Used without arguments, thestatuscommand shows the status of all nodes. You can also specify a node (e.g.,kirk) to view only that particular node. -
deploy: Re-reads all system configuration files without restarting the Bro daemon process. You use this command without arguments. -
netstats: Provides statistics concerning all activated interfaces. -
scripts: Reports the scripts that Bro is using. -
top: Shows how much memory Bro is using.
See the Bro documentation for more on Bro commands [7].
Viewing Bro Logfiles
Once you have configured Bro and re-loaded its configuration files, it's time to look into logging. You can view the logfiles in the /nsm/bro/logs/ directory. This directory will contain several subdirectories and one file. The subdirectories are organized by date. You will also find a file named current, which, in this case, is a symbolic link to the kirk node. This node will contain several different logfiles, such as:
weird.logcommunication.logdns.logpacket_filter.logssl.loghttpd.logscripts.log
I've found that the weird.log, dns.log, httpd.log, and scripts.log files are usually the most interesting. The weird.log file has a notice section, as shown in Figure 3.
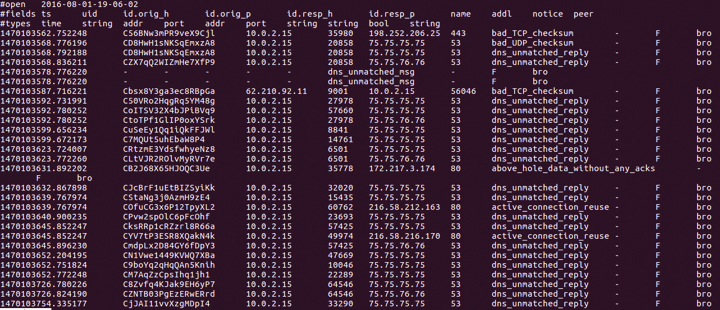
The notice section is interesting to me because, in my consulting experience, I've found that many attackers use attacks that take advantage of improper fragmenting of packets, and in some cases, packets are sent without a matched DNS reply.
Therefore, looking for unmatched DNS replies is a perfect first step in identifying what could be problem packets. In the notice field found in Figure 3, you will see that the packets I generated were tagged by Bro as dns_unmatched_reply, which means that this particular packet didn't have any corresponding DNS entry, either in the corporate DNS database or on the Internet.
Although you can't live or die by this one bit of information about DNS entries, it's very much a tell-tale sign. This is how Bro works: It gathers information and tell-tale signs and helps you identify issues and interpret possible security events.
Marking fragments is also important because firewalls tend to study only the first part of a packet. If an attacker can carefully craft a packet to avoid firewall detection by placing an improper fragment at the end of a packet, this improper fragment can then be used to confuse routers and conduct various denial of service attacks.
Bro does more than notice fragmented packets. Notice the active_connection_reuse field in Figure 3. Active connection reuse can denote man-in-the-middle attacks. They can also denote packets that have been re-sent out on the network. In this case, Bro is discovering that the packets I created have been used before; once again, Bro is excellent at tagging data. This ability to tag data allows you to identify trends on the network.
Denial of service attacks, of course, usually deploy forged network packets. Bro can easily mark such traffic and then find a way to see how this type of traffic is changing over time. Doing this can help identify trends, something that is increasingly important today.
Testing Bro
Once Bro is up and running, the next step is to test it. One way to test is to use packet-generating software. In my case, I'm using the old but (relatively) trusty PackETH program, shown in Figure 4.
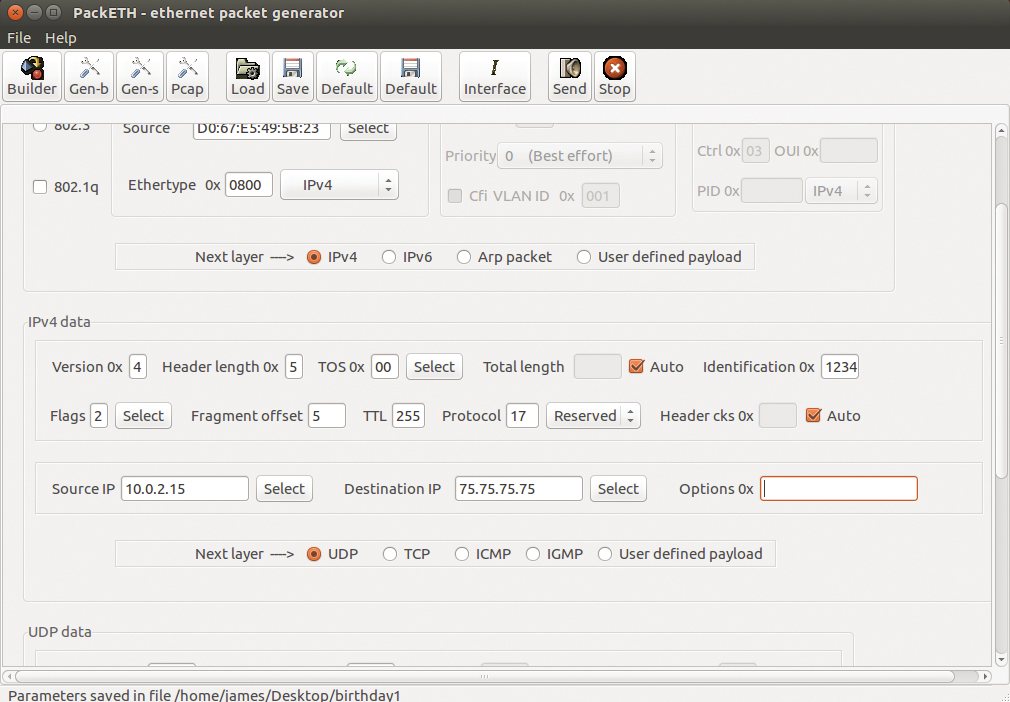
PackETH is a fairly grumpy program that requires you to know your TCP/IP suite cold; you need to understand all elements of the IP header, as well as how TCP and UDP work, and you need to understand the MAC address. You'll need to know it all.
In my case, I created a fake packet to test fragmentation. I created a simple UDP packet that includes an improper length. In addition to forging packets, PackETH can send them across the network wire.
Next, I used PackETH to send the packet across the wire. To verify this transmission, I used Wireshark to do a standard, run-of-the-mill capture, as shown in Figure 5.

Wireshark captured the traffic sent by PackETH, but notice that, as you might expect, Wireshark simply shows you the information without providing any sort of real interpretation. In fact, it simply shows that a series of packets have been sent. Wireshark is terrific at grabbing data, but it isn't so good at turning that data into information. That's your job, with help of Bro.
Figure 6 shows the same series of packets found in Bro's weird.log file, which I found in the current/ directory:
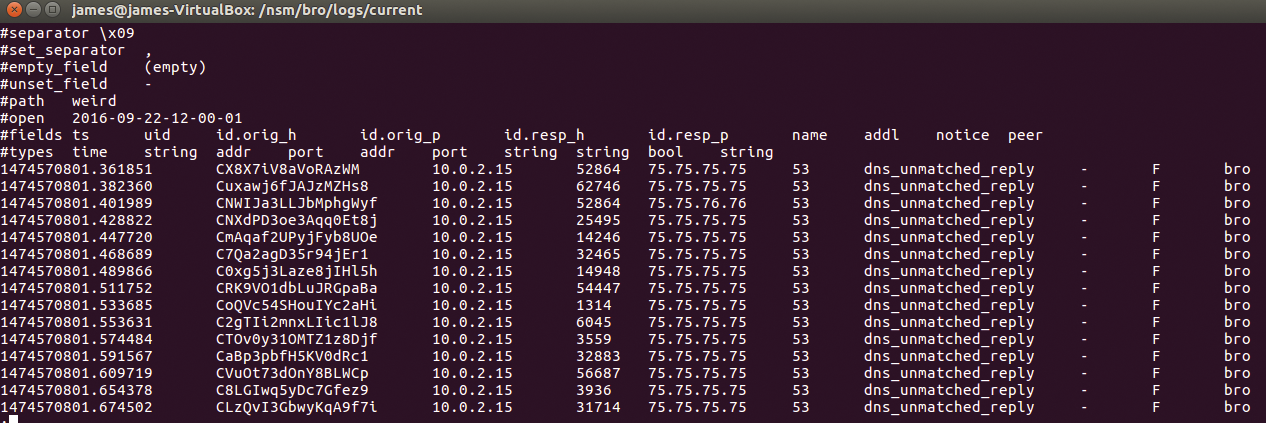
Notice that, now, the data is marked as having an unmatched DNS reply. This mark enables you to identify more quickly an issue in a protocol on your network.
Figure 7 shows something else. Bro is also capable of finding whether an active TCP connection has been re-used. You can see Bro marking this traffic in the entry marked active_connection_reuse.
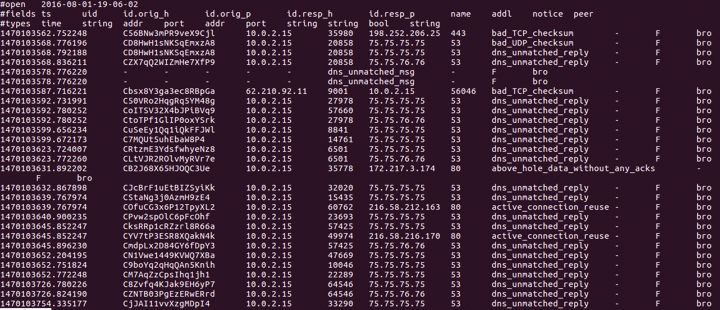
Active connection reuse can sometimes reveal a replay attack, as well a connection hijacking attack. In this case, Bro is noticing that I have taken packets and replayed them onto the network using PackETH.
Managing Bro Policies
Bro lets you specify policies to define capture behavior. The best way to reduce or increase the amount of information you capture is to manage the policies that load whenever Bro re-reads its configuration files. By default, Bro will read all of the policies found in the directory /nsm/bro/share/bro/policy/protocols/. These policies are relatively simple text files, and it is possible to create your own scripts or download additional scripts.
Policies capture information about connection types, protocols (e.g., DHCP, FTP, HTTP, SSH), and connections. The list is quite comprehensive. In my implementation of Bro, I can list the policies that are loaded by using the command:
[BroControl] > scripts -c kirk
If you want to disable a policy, simply remove the script from the directory; then, make sure to re-load the scripts from within BroControl using the deploy command:
[BroControl] > deploy
Don't Like Reading Logs? Try the ELK Stack
You and your boss probably don't want to spend a lot of time reading raw logfiles. Users often combine Bro with data visualization tools for more effective presentation. One popular set of open source tools for data collection and presentation is the so-called "ELK" stack, which comprises:
- Elasticsearch: Enables sophisticated searches of large amounts of volatile data.
- Logstash: Collects, stores, and parses logfiles from remote hosts.
- Kibana: Visualizes data so that it appears less abstract and has higher impact.
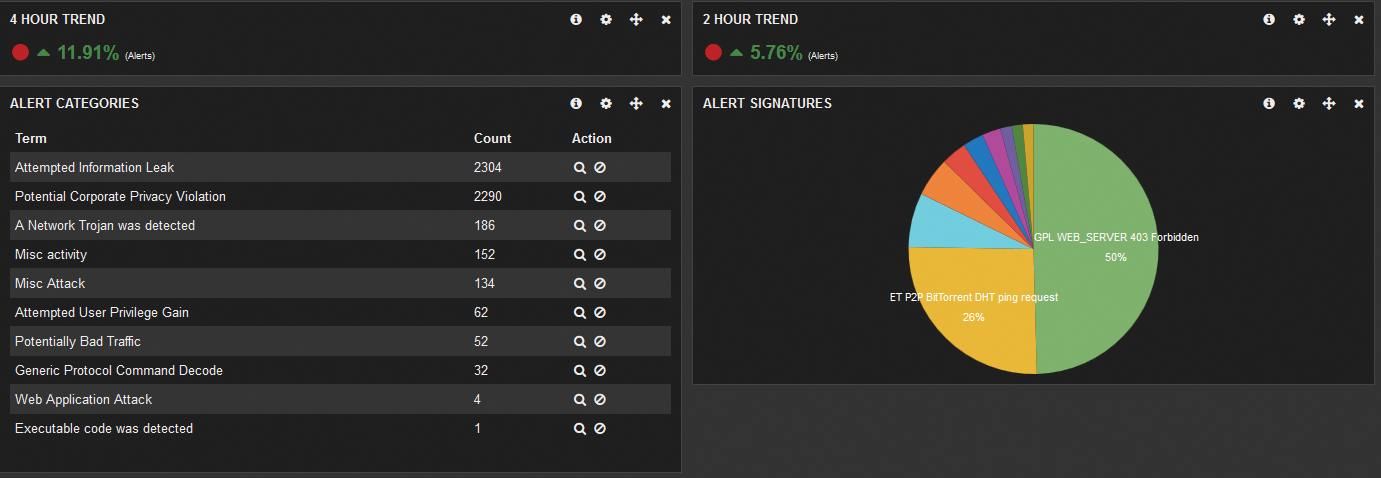
These applications provide a graphical visualization of the logfiles you've captured with Bro. For example, Figure 8 shows Kibana's output of a Bro logfile. Instead of reviewing overly technical data, such as bad_TCP_checksum data, Kibana can visualize this information so that you can identify essential trends on the network.
To set up the ELK stack, start by installing Java 8, or the latest stable version. In my system, I used the commands in Listing 1 to set up the ELK stack and install Elasticsearch. I can then set up the Elasticsearch initialization script:
Listing 1: ELK Stack and Elasticsearch
# Set up ELK stack
$ sudo add-apt-repository -y ppa:webupd8team/java
$ sudo apt-get update
$ echo debconf shared/accepted-oracle-license-v1-1 select true | sudo debconf-set-selections
$ echo debconf shared/accepted-oracle-license-v1-1 seen true | sudo debconf-set-selections
$ sudo apt-get -y install oracle-java8-installer
# Install Elasticsearch
$ wget -qO - https://packages.elastic.co/GPG-KEY-elasticsearch | sudo apt-key add -
$ echo "deb http://packages.elastic.co/elasticsearch/2.x/debian stable main" | sudo tee -a /etc/apt/sources.list.d/elasticsearch-2.x.list
$ sudo apt-get update && sudo apt-get install elasticsearch
$ sudo update-rc.d elasticsearch defaults 95 10
Once Elasticsearch is installed, I then installed Logstash:
$ echo "deb https://packages.elastic.co/logstash/2.3/ debian stable main" | sudo tee -a /etc/apt/sources.list
$ sudo apt-get update && sudo apt-get install logstash
Make sure Logstash is part of the startup scripts:
$ sudo update-rc.d logstash defaults 95 10
Finally, you can install Kibana:
$ echo "deb http://packages.elastic.co/kibana/4.5/debian stable main" | sudo tee -a /etc/apt/sources.list
$ sudo apt-get update && sudo apt-get install kibana
Once again, I can then create the System V scripts:
$ sudo update-rc.d kibana defaults 95 10
Once I have Kibana running, I can then use the web interface to point it toward my Bro log directories (e.g., those in the current directory), then I can start parsing and visualizing data.
Conclusion
Network security monitoring software has been around a long time. But now, we're starting to see software, such as Bro, that has a bit more capability. Instead of merely looking for pre-defined traffic patterns, Bro has the ability to identify trends. Using visualization software such as the ELK stack, it is possible to sift through all of this data to discover truly useful trends. The key, of course, is in properly configuring Bro to process relevant information. This takes a bit of fine tuning of scripts, as well as quite a bit of trial and error. But with some time, you'll be able to identify key security issues and trends quickly. Although you might not think you're doing "big data," with Bro, you are, in a very real sense. You're taking unstructured data and quickly discovering meaningful patterns, and these trends represent information that you will find truly useful in your work.
