Proactive monitoring
Good for You!
Many monitoring solutions respond to a problem once a threshold set by the admin is reached. These values derive mostly from experience. An alarm triggered by an overrun threshold can darken the mood of the team member on call when, for example, hard disk drive loads increase beyond defined limits during a backup in the middle of the night.
Instead of this reactive monitoring, developer Kyle Kingsbury and his team recommend proactive monitoring with Riemann [1], which allows you to predict imminent failures and initiate countermeasures in a timely manner.
The program, first published in 2012, is an event-stream processor; that is, connected hosts use a log buffer to send events to the Riemann server. Each event contains data for the host, a service description, a status, the time of the measurement, and a validity period. Riemann processes the received events and aggregates values to statistical mean values. A functional language configures the event flow; for example, you could forward the data to other programs for the purpose of evaluation, alert the on-duty employee or team, or both.
How Are You?
Proactive monitoring thus reverses the direction of intervention compared with reactive monitoring: Monitored hosts send metrics to Riemann, and they assess their status themselves, rather than leaving this decision to a central instance [2]. In addition to the server, which is implemented in Clojure and runs in a Java virtual machine, Riemann has a web interface (the Riemann Dash) and various clients for Linux, OS X, and Windows.
The Riemann service stores all the information in its index and uses this to respond to the client requests. The index resides exclusively in RAM and stores precisely one value – the latest – for each metric received. In other words, after restarting the Riemann process, you cannot reference previous events, so historical analyses are only possible if you have set up logging for the components.
With the help of external tools, this minor flaw is easily removed. In addition to installing and configuring the server, I will show you how to work with Linux clients (see the "Test Environment" box), what opportunities the Riemann Dash offers, and how users can archive the acquired data in the long term.
On its homepage, the Riemann project [1] offers a Debian and RPM package as downloads, as well as the sources. A prerequisite for the installation and operation of Riemann is a Java Software Development Kit (JDK); according to the project page, Riemann works with the Oracle JDK and OpenJDK versions 7 and 8. On our lab machine, the test team used OpenJDK 1.8 from the Extra Packages for Enterprise Linux (EPEL) repository. For the Riemann client and dashboard, you also need to install the ruby-dev package.
The Riemann server package includes the precompiled Clojure bytecode, a shell script for starting, stopping, and reloading the configuration (/etc/init.d/riemann) and a minimal setup file (/etc/riemann/riemann.config), which is fine for your first steps. On current distributions, systemd uses the init script to control the demon. CentOS 7, however, is prevented at the present time from running service riemann reload. The problem is well known [3] and should be fixed in the next release. Because the index resides in volatile memory, stopping and then restarting is not a good idea. As an interim solution, you can send kill -SIGHUP manually to the Riemann PID.
Well Set Up
Before you get down to the nitty-gritty, you need to see that sending and receiving events works. To do so, install the command-line interface:
sudo gem install riemann-cli
which triggers the installation of more Ruby Gems (including Thor, Beefcake, Trollop, and the Riemann client). Listing 1 shows how an event is sent and then read with the riemann-cli tool.
Listing 1: Send and Call Test Event
# riemann-cli send --service=TestEvent --metric="31337" --state=warning --ttl=20 --description="This is a test event" --tags=riemann test
# riemann-cli query --string='service = "TestEvent"'
{host:"dc-monitoring.kr.network.net", service:"TestEvent", state:"warning", time:1472220028, description:"This is a test event", tags:["riemann", "test"], metric_f:31337.0, metric_d:, metric_sint64:31337, ttl:20.0}
As the output shows, the client defines all the fields and sends them to the server. The tags option allows you to group hosts or carry out assignments for production and test environments. The three fields metric_f, metric_d, and metric_sint64 contain the metric as a float, double, or signed 64-bit integer. The clients select the representation desired; Listing 1 shows that Riemann has stored the events as a float and an integer in the index. Last, but certainly not least, you can find information on the validity period of the events (ttl). Riemann checks regularly for events in its index and deletes expired events.
The mailing list [4] has more information about data types. Riemann also supports complex queries. The documentation on the project page contains numerous examples. With a little patience, you can learn the format easily in a short time. You need the same syntax in the Riemann dash to set up widgets (see the "Visualized" section).
The server configuration (/etc/riemann/riemann.config) is a Clojure script [5]. The functions of this Lisp dialect follow Polish notation (i.e., first the function, then all the arguments). For example (+ 1 3) first defines an addition and then lists the additions. For an introduction to Clojure programming and its basic concepts, you can check out a previous article [6] and find educational materials online [7].
Listing 2 shows the central Riemann server configuration file, as used in the lab environment. The first function of the configuration file enables logging. The logfiles end up in /var/log/riemann/riemann.log. Then, the graph function is defined. It calls a subfunction named graphite; the parameters it receives are the hostname of the Graphite server (see the "Teamwork with Graphite" section).
Listing 2: Configuration of the Central Server
01 ; Enabling the log:
02 (logging/init {:file "/var/log/riemann/riemann,log"})
03
04 ; Connection to Graphite server:
05 (def graph (graphite {:host "graphite-server"}))
06
07 ; Enable all interfaces for TCP, UDP and websockets:
08 (let [host "0.0.0.0"]
09   (tcp-server {:host host})
10   (udp-server {:host host})
11   (ws-server {:host host}))
12
13 ; Clean up events (every 5 seconds):
14 (periodically-expire 5)
15
16 ; Email address used to send notifications:
17 (def email (mailer {:from "riemann@example.com"}))
18
19 ; Index: Definition
20 (let [index (index)]
21   (streams
22     (default :ttl 60
23       ; immediate indexing of all incoming events:
24       index
25
26       ; Forward errors, sorted by tags:
27       (where (state "error")
28         (where (tagged "www")
29           (email "webmaster@example.com"))
30         (where (service = "postgres")
31           (email "dba@example.com"))
32         (where (not (or (tagged "www") (service = "postgres")))
33           (email "admin@example.com")))
34
35       ; Compute existing hosts:
36       (let [hosts (atom #{})]
37         (fn [event]
38           (swap! hosts conj (:host event))
39           (prn :hosts @hosts)
40           (index {:service "unique hosts"
41                   :time (unix-time)
42                   :metric (count @hosts)})))
43
44       ; Forward all events to the Graphite host:
45       graph
46
47       ; Log inactive events:
48       (expired
49         (fn [event] (info "expired" event)))))
50 )
Next, enable port interfaces for TCP (5555), UDP (5555), and websockets (5556). The supplied file sets up for localhost. To tell the Riemann service to listen on all available network interfaces, you can change 127.0.0.1 to 0.0.0.0. If you have security concerns, you will find a guide to securing your network with TLS [8].
Specifying (periodically-expire 5) tells Riemann to remove events whose TTL has expired from its index every five seconds. The email function expects the address of the sender as a parameter; the Clojure email library postal takes care of everything else [9]. Riemann also can deliver email via SMTP [10].
The next block (lines 19-33) defines the index and a stream that includes all incoming events. The default TTL is 60 seconds for all events, unless otherwise set by a client. Some filters then generate email for different recipients from events; the email contains an error status as well as a specific tag. In this way, the messages that reach the database maintainer are not the same messages that reach the web server admin. All other error messages are sent to a third manager.
Especially in cloud environments, where the number of hosts can scale, it is useful to track with a separate stream how many hosts send data to Riemann. The next function (lines 35-42) thus computes the number of hosts that send events to the Riemann server and writes these to the index as the "unique hosts" service. The last two sections (lines 44-49) make sure that the graph function sends all the events to the Graphite server and that the expired function logs all expired events in the previously defined logfile.
After you have edited the file, load the new configuration with service reload or kill SIGHUP. A look in the logfile confirms the accuracy of your changes. It lists any potential syntax errors along with the setup file line numbers, making it easier to debug. In the case of an error, Riemann kindly continues with the old configuration rather than quitting. If you prefer a manual test at the console before reloading, you can call riemann test along with the setup file (Listing 3).
Listing 3: Testing the Riemann Configuration
# riemann test /etc/riemann/riemann.config
INFO [2016-08-29 14:44:45,019] main - riemann.bin - Loading /etc/riemann/riemann.config
INFO [2016-08-29 14:44:45,221] clojure-agent-send-off-pool-2 - riemann.graphite - Connecting to  {:host graphite, :port 2003}
INFO [2016-08-29 14:44:45,224] clojure-agent-send-off-pool-0 - riemann.graphite - Connecting to  {:host graphite, :port 2003}
[...]
INFO [2016-08-29 14:44:45,375] clojure-agent-send-off-pool-2 - riemann.graphite - Connected to 192.168.144.69
Testing clojure.core
Ran 0 tests containing 0 assertions.
0 failures, 0 errors.
The previously mentioned riemann-cli tool tests mail delivery:
riemann-cli send --service=Mailtest --metric="3l337" --state=error -ttl=20 --description="Mail function test" --tags=riemann test www
This command tells the Riemann server to send a message to the addresses stored in the configuration.
Branch Office
The test setup has an additional server that receives local events from the web and database server and forwards them to the Riemann service at the main data center. Strictly speaking, this satellite server acts like a Riemann client. Listing 4 shows a forwarding scenario: The tcp client object's host attribute expects the "dc_monitoring" parameter. It directs all events with the attributes host and service to this target. The main server makes no distinction between direct and routed events.
Listing 4: Forwarding with Riemann
(let [client (tcp-client :host "dc_monitoring")]
  (by [:host :service]
    (forward client)))
Filtering events is especially useful in large environments and for load balancing. Conceivably, you could only forward events with a status of warning or critical. Listing 5 is an extension of Listing 4; now the server only sends events with the error status to the main server.
Listing 5: Filtering Events
(let [client (tcp-client :host "dc_monitoring")]
  (by [:host :service]
    (where (state "error")
      (forward client))))
Finally, a tip for those who intend to deploy Riemann in large environments: With numerous streams and events, a single setup file can quickly become confusing. Although it was possible up to version 0.2.10 to include other Clojure files using an include statement, the current version uses Clojure namespaces. For notes on usage and examples, see the Riemann how-to [11] and the Brave Clojure page [12].
Riemann Clients
After making sure the Riemann server can receive streams and events, it is time to set up clients. The Riemann project provides tools that collect and send common metrics for observing CPU load, processes, and disk fill levels and to monitor common daemons, such as web, proxy, and NTP. All of these tools are bundled in the riemann-tools package and can be installed by typing on the client machine:
sudo gem install riemann-tools
Less frequently used or more complex tools, such as monitoring AWS instances (riemann-aws), Elasticsearch (riemann-elasticsearch), and Docker installations (riemann docker), are available as separate Gems. A search using gem search riemann- discovers a number of clients, and the project page also lists interesting external applications [13]. GitHub has clients for Windows, and thanks to Homebrew, Riemann also runs on OS X [14].
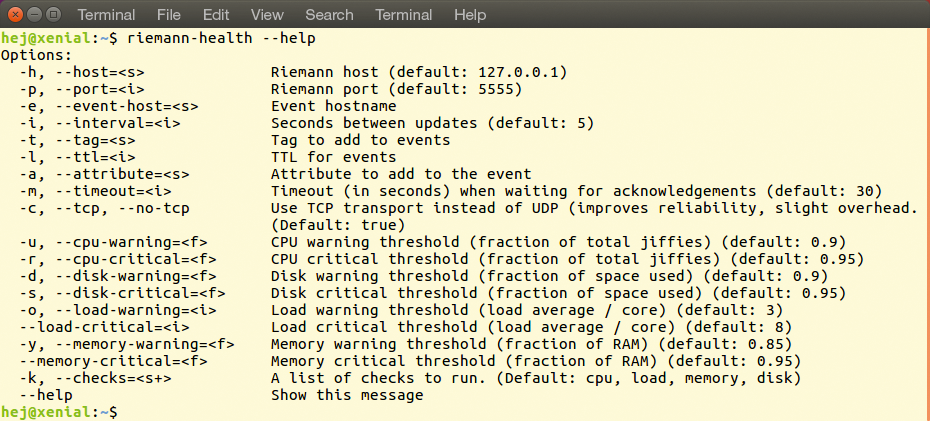
The individual tools do not have separate man pages, but the -help parameter reveals the most important options. For example, the riemann-health program bundled in the riemann-tools gem monitors CPU, hard disk, memory, and load (Figure 1). The -h switch names the Riemann server, and -e specifies the client name; optional specifications on warning values and critical values for the CPU, hard disks, and load follow:
riemann-health -h <Server> -e <Client> -u 0.2 -r 0.5 -d 0.2 -s 0.3 -o l &

-help parameter lists the known options for all Riemann programs.Each metric has a process that passes its values to the Riemann server. Depending on the number of system parameters you want to monitor, you will see that a number of processes were created just for monitoring.
You will search in vain for startup scripts that save you from entering these long commands at every boot; however, individual systemd unit files (services here) under /etc/systemd/system are a potential solution. Listing 6 shows an example of the riemann-health.service unit on client bert that keeps an eye on the processor, disks, and memory.
Listing 6: Service Unit for riemann-health
[Unit]
Description=Riemann Health
After=network.target
[Service]
ExecStart=/usr/local/bin/riemann-health --host dc_monitoring --event-host=bert -u 0.2 -r 0.5 -d 0.2 -s 0.3 -o 1 --load-critical=2
PidFile=/var/run/riemann-health.pid
Restart=on-failure
[Install]
Alias=riemann-health.service
Now that the Riemann server is receiving data from clients, you need to think about notification options. Listing 2 shows what email alerts might look like. The Clojure configuration supports other approaches, such as SMS, IRC, or cooperation with external services [10] such as HipChat, PagerDuty, Blueflood, or Campfire.
To capture a coherent current state of all clients, you can install the riemann-dash Ruby gem. Implemented in the Sinatra web application framework, the tool pulls in some dependencies. After starting the command of the same name, you reach the web interface on http:/localhost:4567. For an example of the configuration file that adapts this and other options for your own server, see the Riemann GitHub page [15].
The config.rb file must be located in the same directory from which you launch riemann-dash. Alternatively, you can set the RIEMANN_DASH_CONFIG variable appropriately. Again, you'll find no startup script, but you can create a systemd service unit.
Visualized
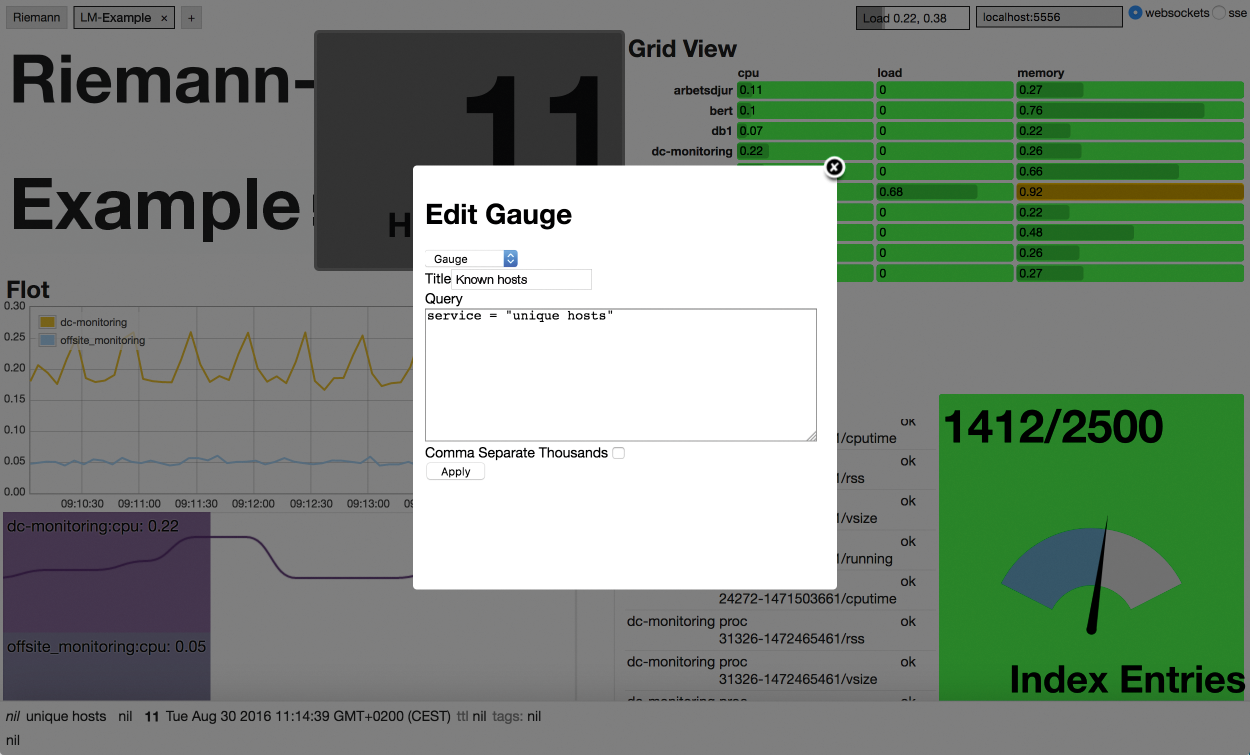
At first glance, the web interface does not offer much, with only two widgets on view: Riemann and online help, which gives you tips on how to set up. On closer inspection, the interface is quite flexible – once you get used to the rather convoluted controls. Queries follow the same syntax used by the command-line programs (Figure 2).

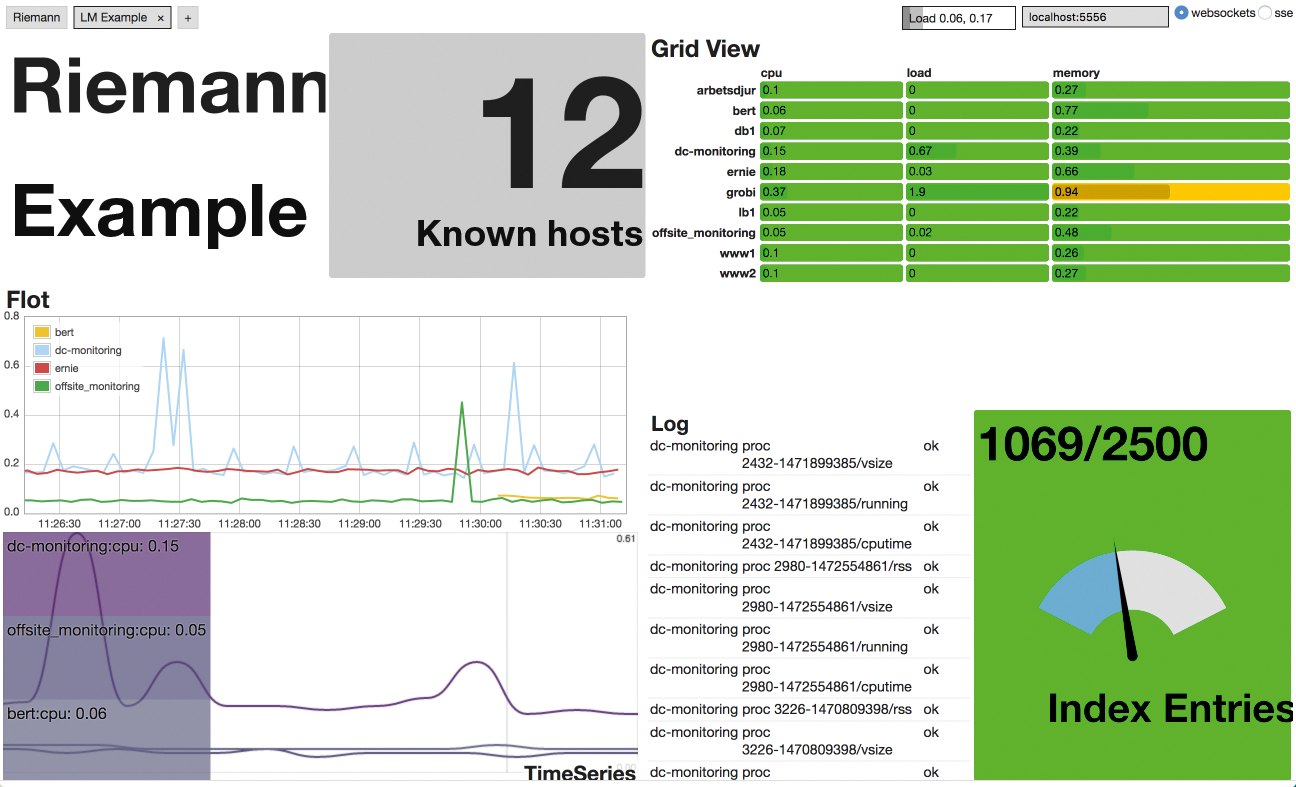
Pressing the Ctrl + arrow keys splits the view as needed (Figure 3). Pressing + and - changes the dimensions, and pressing S saves the current layout. At the top left you will find buttons for adding more tabs for custom dashboards. A double-click in the box lets you change the name. At top right is the current load and an input box. If your Riemann server is not running on the local system, you need enter the correct IP address here.

Teamwork with Graphite
All widgets take their data directly from the Riemann index, which they query via websockets. Because this index resides exclusively in RAM, it is not possible to visualize history data, as mentioned earlier. Integrating an external tool is a potential solution. In the test environment, Graphite [16] handled this job to document long-term trends. Listing 2 shows how to integrate the Graphite service and forward all Riemann events to it. If you want a more selective approach, you can configure a corresponding stream in the Riemann configuration file; the following example only sends events from the PostgreSQL service:
(streams
  (where (service "postgres")
    graph))
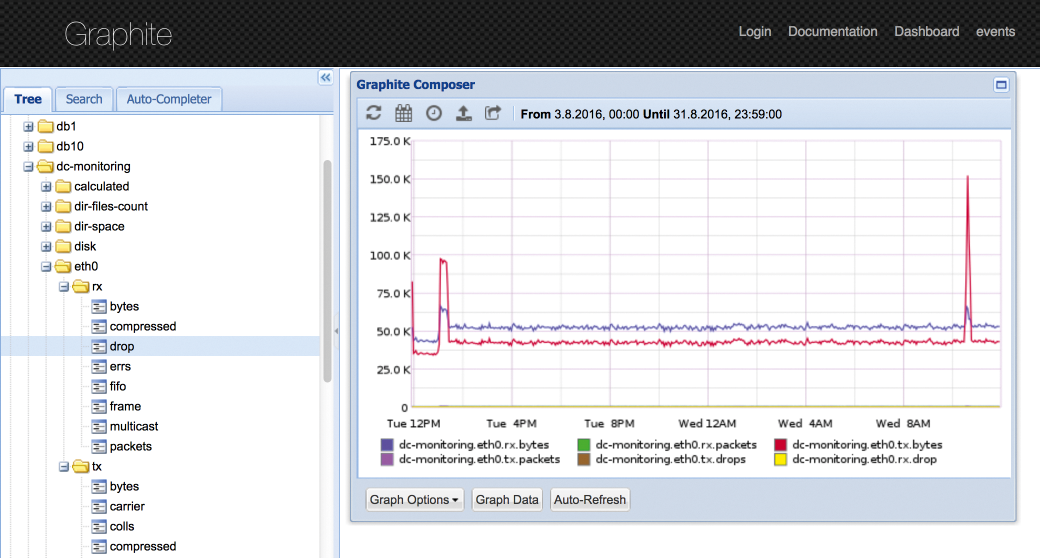
Graphite itself requires no special settings to handle Riemann server events. An article on the Linux Administration website describes how to install and use Graphite [17]. You can access the web console on http://localhost:8080. The clients are listed in a tree view on the left. To view an entry in Graphite Composer on the right (Figure 4), just click on it. You can define specific time periods and customize the chart's appearance.

Frugal
Riemann takes an interesting approach, but definitely has its weaknesses. The configuration Clojure syntax is likely the biggest obstacle; if you are not familiar with it, you will need to allow for a longer training period. Thanks to the documentation on the project site and the examples, this task can be mastered.
Another issue is certainly the client design – one process per metric is not very smart; in fact, it can even distort the acquired values depending on the scope of the setup. Therefore, a setup that bundles Riemann with a statistics daemon like Collectd [18], which collects the metrics and then sends them to Riemann, makes sense.
High availability (e.g., synchronization between multiple nodes, failover, or load balancing) is not addressed. If you do not want to follow the example here, with multiple servers that report to a central instance, you can follow the developer's recommendation. In the how-to, they suggest using two servers with a floating IP. The evaluation is then based on events that are sent to one of the two servers depending on the floating IP status.
One genuine benefit is that Riemann outsources threshold values to the clients to handle, which simplifies the deployment of new systems – and not just in large organizations. For the notification problem during a nightly backup, mentioned in the first paragraph of this article, the backup software could report to Riemann via its internal metrics and temporarily adapt thresholds to the changed situation.
