Getting the most from your cores
Strong Core
In a general sense, high-performance computing (HPC) means getting the most out of your resources. This translates to utilizing the CPUs (cores) as much as possible. Consequently, CPU utilization becomes a very important metric to determine how well an application is using the cores. On today's systems with multiple cores per socket and various cache levels that may or may not be shared across cores, determining CPU utilization might not be easy or simple to determine.
To explain this, a definition of CPU utilization is needed. As a starting point, I'll use the definition from Techopedia [1], which states:
CPU utilization refers to a computer's usage of processing resources, or the amount of work handled by a CPU. Actual CPU utilization varies depending on the amount and type of managed computing tasks. Certain tasks require heavy CPU time, while others require less because of non-CPU resource requirements.
The definition goes on to state:
CPU utilization should not be confused with CPU load.
This is a very important point in the quest for measuring CPU utilization of HPC applications – don't confuse CPU load and CPU utilization.
In the days of single-core CPUs, CPU utilization was fairly straightforward. If a processor was operating at a fixed frequency of 2.0GHz, CPU utilization was the percentage of time the processor spent doing work. (Not doing work is idle time.) For 50% utilization, the processor performed about 1 billion cycles worth of work in one second. Current processors have multiple cores, hardware multithreading, shared caches, and even dynamically changing frequencies. Moreover, the exact details of these components varies from processor to processor, making CPU utilization comparison difficult.
Current processors can have shared L3 caches across all cores or shared L2 and L1 caches across cores. Sometimes these resources are shared in interesting ways. The example in Figure 1 is the Xeon E5 v2 to Xeon E5 v3 processors.
![Xeon E5 v2 to Xeon E5 v3 architectures (courtesy of EnterpriseTech [2]). Xeon E5 v2 to Xeon E5 v3 architectures (courtesy of EnterpriseTech [2]).](images/F01-intel-xeon-e5-v3-block-diagram.png)
Notice how the specific CPU architecture changes, moving from the Ivy Bridge (Xeon E5 v2) generation to the Haswell (Xeon E5 v3) generation and how the resources are shared differently in the two architectures.
Equally as important is how the various applications or "bits of work" are distributed. As a result, when resources are shared, the net effect on performance becomes dependent on workload.
Illustrating this point is fairly simple. If an application benefits from a larger cache and the cache space is shared, the performance can suffer because of cache misses. Memory access performance is also an important aspect of application performance (getting/putting data into either caches or main memory). The reported CPU utilization times include the time spent waiting for cache or memory access. This time can be larger or smaller based on the amount and the kind of resource sharing that is going on in the CPU.
Symmetric multithreading (SMT), as in Intel's Hyper-Threading technology, has logical cores that are the same as physical cores and may have execution units shared between them. These processors also have non-uniform memory access (NUMA) characteristics, so the placement of processes, including pinning them to certain cores, can have an effect on CPU utilization.
Also affecting CPU utilization are the frequencies of the cores (logical units) doing work. Many processors can turn up their frequency if neighboring cores are idle or doing very little work. The goal is to keep the temperature of the collective processors below a threshold, which means the frequency of the various cores can vary while an application is running, which also affects CPU utilization and, more importantly, how the frequency or work capability of the processor is computed.
Yet another event with an effect on CPU utilization is virtualization, which can introduce more complexity into the problem of CPU utilization because allocation of work to the various cores is performed by the hypervisor rather than the guest OS, so the performance counters used for measuring CPU utilization should be hypervisor-aware.
All of these factors interact so that measuring CPU utilization is not as easy as it might seem. Furthermore, trying to translate CPU utilization from one CPU architecture to another can result in very different results. Understanding the CPU architectures and how CPU utilization is measured are keys for making the transition.
Utilization or Load?
As mentioned in the first section of the article, "CPU utilization should not be confused with CPU load." This is a very critical distinction that will prevent confusion.
In Linux (and *nix computing in general), system load is a measure of work that the system performs. The classic uptime (or w) command lists three load averages for 1, 5, and 15-minute time periods. When the system is idle, the load number is zero. For each process that is using or waiting for the CPU, the load is incremented by one. Typically, this includes the effect of processes blocked in I/O, because busy or stalled I/O systems are increasing the load average, even though the CPU is not being used. Moreover, the load is computed as an exponentially damped/weighted moving average [3] of the load number. Note that the average is computed.
As a result, using load to measure CPU utilization has drawbacks, because processes blocked in I/O mask the true load and the use of a computed load average skews the results. The moral is that if accurate CPU utilization measurements are needed, don't use load measurements.
psutil
You can find a number of articles around the Internet about CPU utilization on Linux machines. Many of them use uptime or w, which, as I've illustrated, aren't the best ways to determine CPU utilization, particularly if testing an HPC application that uses a majority of the cores.
For this article, I use psutil [4], which is a cross-platform library for gathering information on running processes and system utilization. It currently supports Linux, Windows, OS X, FreeBSD, and Solaris; has a very easy-to-use set of functions; and can be used to write all sorts of useful tools. For example, the author of psutil wrote a top-like tool [5] in a couple hundred lines of Python.
The psutil documentation [6] discusses several functions for gathering CPU stats, particularly CPU times and percentages. Moreover, these statistics can be gathered with user-controllable intervals and for either the entire system (all cores) or every core individually. Thus, psutil is a great tool for gathering CPU utilization stats.
As an example of what can be done with psutil for gathering CPU utilization statistics, a simple Python program was written that gathers CPU stats and plots them using Matplotlib (Listing 1). The program is just an example of gathering CPU statistics with some values hard-coded in.
Listing 1: Collect and Plot CPU Stats
01 #!/usr/bin/python
02
03 import time
04
05 try:
06    import psutil
07 except ImportError:
08    print "Cannot import psutil module - this is needed for this application.";
09    print "Exiting..."
10    sys.exit();
11 # end if
12
13
14 try:
15    import matplotlib.pyplot as plt;   # Needed for plots
16 except:
17    print "Cannot import matplotlib module - this is needed for this application.";
18    print "Exiting..."
19    sys.exit();
20 # end if
21
22
23 def column(matrix, i):
24     return [row[i] for row in matrix]
25 # end def
26
27
28 # ===================
29 # Main Python section
30 # ===================
31 #
32 if __name__ == '__main__':
33
34     # Main dictionary
35     d = {};
36
37     # define interval and add to dictionary
38     interv = 0.5;
39     d['interval'] = interv;
40
41     # Number of cores:
42     N = psutil.cpu_count();
43     d['NCPUS'] = N;
44
45     cpu_percent = [];
46     epoch_list = [];
47     for x in range(140):   # hard coded as an example
48         cpu_percent_local = [];
49         epoch_list.append(time.time());
50
51         cpu_percent_local=psutil.cpu_percent(interval=interv,percpu=True);
52         cpu_percent.append(cpu_percent_local);
53     # end for
54
55     # Normalize epoch to beginning
56     epoch_list[:] = [x - epoch_list[0] for x in epoch_list];
57
58     # Plots
59
60     for i in range(N):
61         A = column(cpu_percent, i);
62         plt.plot(epoch_list, A);
63     # end if
64     plt.xlabel('Time (seconds)');
65     plt.ylabel('CPU Percentage');
66     plt.show();
67 # end if
An Example
The point of the code is not to create another tool but to implement it when running example programs to illustrate how CPU utilization stats can be gathered. The programs used in this example are the NAS Parallel Benchmarks (NPB) [7]. Version 3.3.1 using OpenMP was used here. Only the FT test (discrete 3D fast Fourier transform, all-to-all communication) was run and the Class B "size" standard test (a four times size increase going from one class to the next) was used on a laptop with 8GB of memory using two cores (OMP_NUM_THREADS=2).
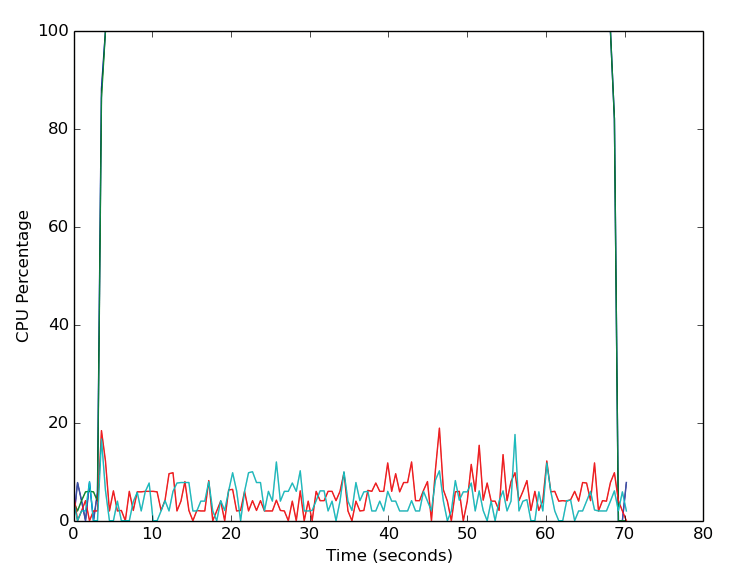
Initial tests showed that the application finished in a bit less than 60 seconds. With an interval of 0.5 seconds between statistics, 140 function calls gathered the statistics (this is hard-coded in Listing 1).
To better visualize the CPU utilization statistics, a "pause" is used at the beginning so that CPU utilization is captured on a relatively quiet system. Also, the application finishes a little faster than 60 seconds, so the CPU utilization stats capture the system "quieting down" after the run.
One important thing to note is that the application was run on a system that was running X windows and a few other applications and daemons; therefore, the system was not completely quiet (i.e., 0% CPU utilization) when the application was not running.
Figure 2 is the plot of CPU utilization versus time in seconds (relative to the beginning of gathering the statistics). This plot doesn't have a legend, so it might be difficult to see the CPU utilization of all four cores. However, at the bottom of the plot are two lines representing CPU utilization of two of the four cores. For these two cores, CPU utilization while the NPB FT Class B application is running is quite low (<20%). However, for the other two cores, the CPU utilization quickly goes to 100% and stays there most of the time the statistics were gathered, although in this graph, it only looks like one line.

For this particular example, the application was not "pinned" to any cores, which means the processes were not tied to a specific core in the processor and were not moved by the kernel. If processes are not pinned to a core, it is possible for the kernel to move them between cores. In that case, the CPU utilization plots would show a specific core at a high percentage that then drops low, while the CPU utilization on a different core rises dramatically.
For this example, the kernel did not move any processes, most likely because two cores are available for running daemons or any other process that needs CPU cycles. If the application had been run with four threads, the plot would have been more chaotic, because the kernel would have had to move or pause processes to accommodate daemons or other processes when they started.
Conclusion
CPU utilization charts can be very useful because they visually indicate how heavily a core is utilized. If the utilization is fairly high (close to 100%) but then drops low for a noticeable period of time, something is causing the core to become idle. The reasons for CPU utilization to drop could be from waiting on I/O (reads or writes) or because of network traffic from one node to another (possibly MPI communication).
In a general sense, CPU utilization provides an idea of how well an application is performing and if it is using the cores as it should. Remember, the first two letters in HPC stand for "High Performance."
