Monitoring network computers with the Icinga Nagios fork
Server Observer
A server can struggle for many reasons: System resources like the CPU, RAM, or hard disk space could be overloaded, or network services might have crashed. Depending on the applications that run on a server, consequences can be dire – from irked users to massive financial implications.
Therefore, it is more important than ever in a highly networked world to be able to monitor the state of your server and take action immediately. Of course, you could check every server and service individually, but it is far more convenient to use a monitoring tool like Icinga.
Nagios Fork
Icinga [1] is a relatively young project that was forked from Nagios [2] because of disagreements regarding the pace and direction of development. Icinga delivers improved database connectors (for MySQL, Oracle, and PostgreSQL), a more user-friendly web interface, and an API that lets administrators integrate numerous extensions without complicated modification of the Icinga core. The Icinga developers also seek to reflect community needs more closely and to integrate patches more quickly. The first stable version, 1.0, was released in December 2009, and the version counter has risen every couple of months ever since.
Icinga comprises three components: the core, the API, and the optional web interface. The core collects system health information generated by plugins and passes it via the IDOMOD interface to the Icinga Data Out Database (IDODB) or the IDO2DB service daemon. The PHP-based API accepts information from the IDODB and displays it in a web-based interface. Additionally, the API facilitates the development of add-ons and plugins.
Icinga Web is designed to be a state-of-the-art web interface that is easily customized for administrators to keep an eye on the state of the systems they manage. At the time of writing, Icinga Web was in beta, and it has a couple of bugs that make it difficult to recommend for production use.
If you only need to monitor a single host, Icinga is installed easily. Some distributions offer binaries in their repositories, but if not, or if you prefer to use the latest version, the easy-to-understand documentation includes a quick-start guide (for the database via libdbi with IDOUtils), which can help you set up the network monitor in next to no time for access at http://Server/icinga. The challenges come when you want to monitor a larger number of computers.
Icinga can monitor the private services on a computer, including CPU load, RAM, and disk usage, as well as public services like web, SSH, mail, and so on. The lab network environment consists of three computers, one of which acts as the Icinga server; the other two are a web server and a file server that send information to the monitoring server. Because no native approach lets you request information externally about CPU load, RAM, or disk space usage, you need to install a verbose add-on, such as NRPE [3], on each machine. The remote Icinga server will tell it to execute the plugins on the local machine and transmit the required information. Icinga sends the system administrator all the information needed and alerts the admin of emergencies. Advanced features that are a genuine help in daily work include groups, redundant monitoring environments, notification escalation, and check schedules.
Icinga differentiates between active and passive checks. Active checks are initiated by the Icinga service and run at times specified by the administrator. For a passive check, an external application does the work and forwards the results to the Icinga server, which is useful if you can't actively check the computer (e.g., it resides behind a firewall). A large number of plugins [4] already exist for various styles in Nagios and Icinga. But before the first check, the administrator needs to configure the computers and the services to monitor in Icinga.
The individual elements involved in a check are referred to as objects in Icinga. Objects include hosts, services, contacts, commands, and time slots. To facilitate daily work, you can group hosts, services, and contacts. The individual objects are defined in CFG files, which reside below Icinga's etc/objects directory. The network monitor includes a number of sample definitions of various objects that administrators only need to customize.
In principle, you can define multiple objects in a CFG file, but you can just as easily create separate files for each object in a directory below /path-to-Icinga/etc/objects. Lines that start with a hash mark within an object definition are regarded as comments, as is everything within a line to the right of a semicolon.
Defining Hosts and Services
Listing 1 provides a sample host definition. The host is the web server at a language center (display_name) and is displayed accordingly in the web interface.
Listing 1: my_hosts.cfg
01 # Webserver
02 define host{
03         host_name               webserver
04         alias                   languagecenter
05         display_name                    Server at language center
06         address                 141.20.108.124
07         active_checks_enabled   1
08         passive_checks_enabled  0
09         max_check_attempts              3
10         check_command                   check-host-alive
11         check_interval                  5
12         retry_interval                  1
13         contacts                                spz_admin
14         notification_period             24x7
15         notification_interval   60
16         notification_options    d
17         }
18
19 # Fileserver
20 define host{
21         host_name               fileserver
22         alias                   Fileserver
23         display_name                    Fileserver
24         address                 192.168.10.127
25         active_checks_enabled   1
26         passive_checks_enabled  0
27         max_check_attempts              3
28         check_command                   check-host-alive
29         check_interval                  5
30         retry_interval                  1
31         contacts                                admin
32         notification_period             24x7
33         notification_interval   60
34         notification_options    d,u,r
35         }
To inform the administrator (contacts) when the server goes down (notification_options), I want Icinga to ping (check_command) the server every 5 minutes (check_interval). If the server is still down 60 minutes (notification_interval) after notifying the administrator, I want to send another message.
Icinga is capable of deciding whether a host is down or unreachable (see Table 1). However, to determine that a host is unreachable, you have to define the nodes passed along the route to the host as parents – and this will only work if the routes for outgoing packets are known. The file server definition looks similar.
Tabelle 1: States
|
Option |
Status |
|---|---|
|
Server |
|
|
|
OK |
|
|
Down |
|
|
Unreachable |
|
|
Recovered |
|
Services |
|
|
|
OK |
|
|
Warning |
|
|
Critical |
|
|
Recovered |
|
|
Unknown |
Once the servers are defined, the administrator configures the respective services that Icinga will monitor (Listing 2), along with the matching commands (Listing 3), the intervals (Listing 4), and the stakeholding administrators (Listing 5). The individual configuration files have a similar structure. For each service, you need to consider the interval between checks. One useful feature is the ability to define time slots, within which Icinga will perform checks and, if necessary, notify the administrator. Here, time limitations or holidays can be defined.
Listing 2: my_services.cfg (Excerpt)
01 # SERVICE DEFINITIONS
02 define service{
03                 host_name                       webserver
04                 service_description     HTTP
05                 active_checks_enabled   1
06                 passive_checks_enabled  0
07                 check_command                   check_http
08                 max_check_attempts              3 ;how often to perform the check before Icinga notifies
09                 check_interval                  5
10                 retry_interval                  1
11                 check_period                    24x7
12                 contacts                        spz_admin
13                 notifications_enabled   1
14                 notification_period             weekdays
15                 notification_interval   60
16                 notification_options    w,c,u,r
17                 }
18 define service{
19                 host_name                       fileserver, webserver
20                 service_description             SSH
21                 active_checks_enabled   1
22                 passive_checks_enabled  0
23                 check_command                   check_ssh
24                 max_check_attempts              3
25                 check_interval                  15
26                 retry_interval                  1
27                 check_period                    24x7
28                 contacts                        admin
29                 notifications_enabled   0
30                 }
Listing 3: commands.cfg (Excerpt)
01 # 'notify-service-by-email' command definition
02 define command{
03         command_name    notify-service-by-email
04         command_line    /usr/bin/printf "%b" "***** Icinga *****\n\nNotification Type: $NOTIFICATIONTYPE$\n\nService: $SERVICEDESC$\nHost: $HOSTALIAS$\nAddress: $HOSTADDRESS$\nState: $SERVICESTATE$\n\nDate/Time: $LONGDATETIME$\n\nAdditional Info:\n\n$SERVICEOUTPUT$" | /usr/bin/mail -s "**$NOTIFICATIONTYPE$ Service Alert: $HOSTALIAS$/$SERVICEDESC$ is $SERVICESTA
05 TE$ **" $CONTACTEMAIL$
06         }
07
08 # 'check-host-alive' command definition
09 define command{
10         command_name    check-host-alive
11         command_line    $USER1$/check_ping -H $HOSTADDRESS$ -w 3000.0,80% -c 5000.0,100% -p
12  5
13         }
Listing 4: timeperiods.cfg (Excerpt)
01 define timeperiod{
02         timeperiod_name 24x7
03         alias                   24 Hours A Day, 7 Days A Week
04         sunday                  00:00-24:00
05         monday                  00:00-24:00
06         tuesday                 00:00-24:00
07         wednesday               00:00-24:00
08         thursday                00:00-24:00
09         friday                  00:00-24:00
10         saturday                00:00-24:00
11         }
12
13 define timeperiod{
14         timeperiod_name wochentags
15         alias                   Robot Robot
16         monday                  07:00-17:00
17         tuesday                 07:00-17:00
18         wednesday               07:00-17:00
19         thursday                07:00-17:00
20         friday                  07:00-17:00
21         }
Listing 5: contacts.cfg (Excerpt)
01 define contact{
02         contact_name                                    icingaadmin
03         alias                                           Falko Benthin
04         host_notifications_enabled              1
05         service_notifications_enabled   1
06         host_notification_period                24x7
07         service_notification_period             24x7
08         host_notification_options               d,u,r
09         service_notification_options    w,u,c,r
10         host_notification_commands              notify-host-by-email
11         service_notification_commands   notify-service-by-email
12         email                                   root@localhost
13         }
The contact configuration can include email addresses or cell phone numbers, but to integrate each contact with, for example, an Email2SMS gateway or a Text2Speech system (e.g., Festival), you need a matching command.
Icinga can use macros, which noticeably simplifies and accelerates many tasks because you can use a single command for multiple hosts and services. Listings 2 and 3 give examples of macros.
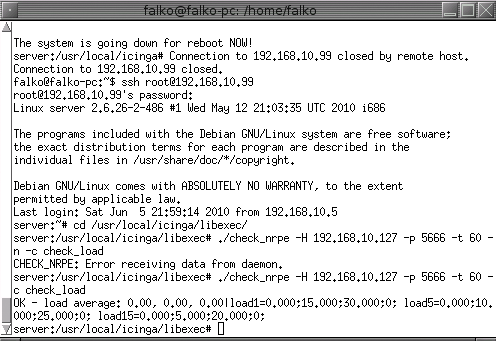
All services defined for monitoring the file server include a check_nrpe instruction with an exclamation mark. Each exclamation mark can be followed by an argument, which in turn is evaluated by the macros in other definitions. Macros are nested in $ signs.
After creating the configuration files and storing them in etc/objects, you still need to tell Icinga by adding a new
cfg_file=/usr/local/icinga/etc/objects/object.cfg
to the main configuration file, /etc/icinga.cfg. After doing so, you should verify the configuration, /path-to-Icinga/bin/icinga -v /path-to-Icinga/etc/icinga.cfg; assuming there are no errors, restart Icinga with /etc/init.d/icinga restart.
GUI and Messages
Icinga works without a graphical interface, but it's much nicer to have one. The standard interface can't deny its Nagios ancestry, but it is clear-cut and intuitive.
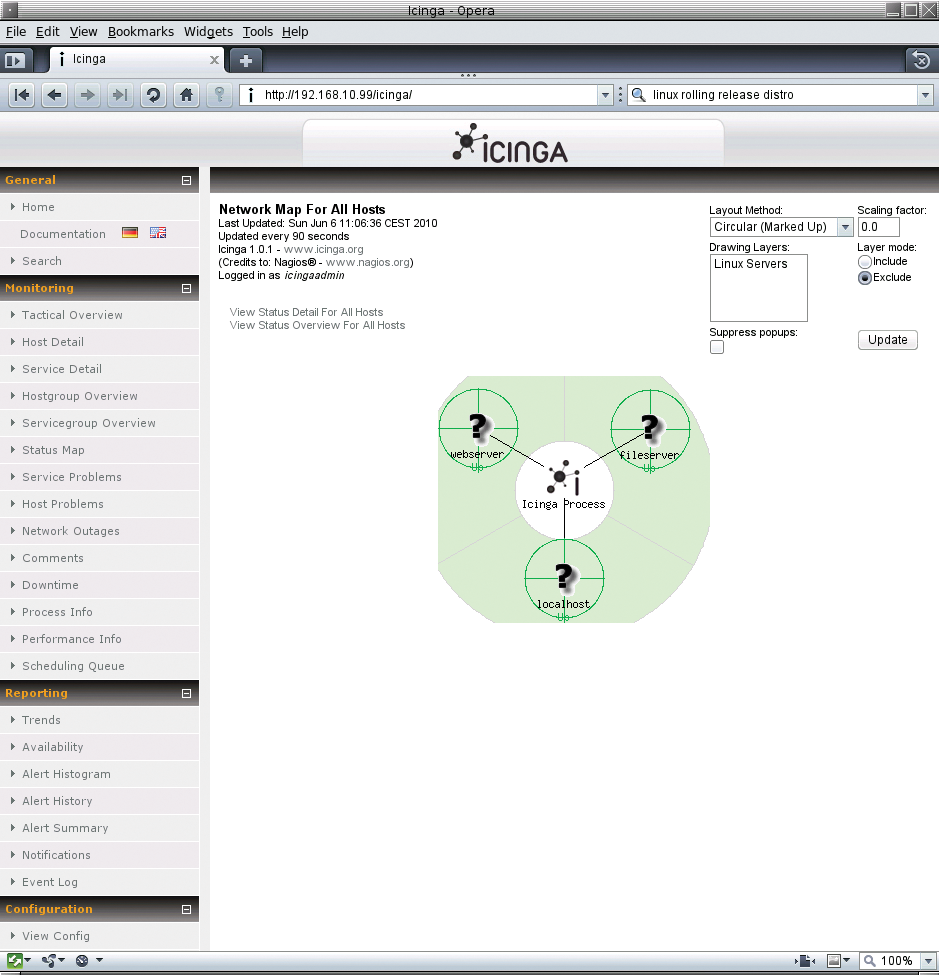
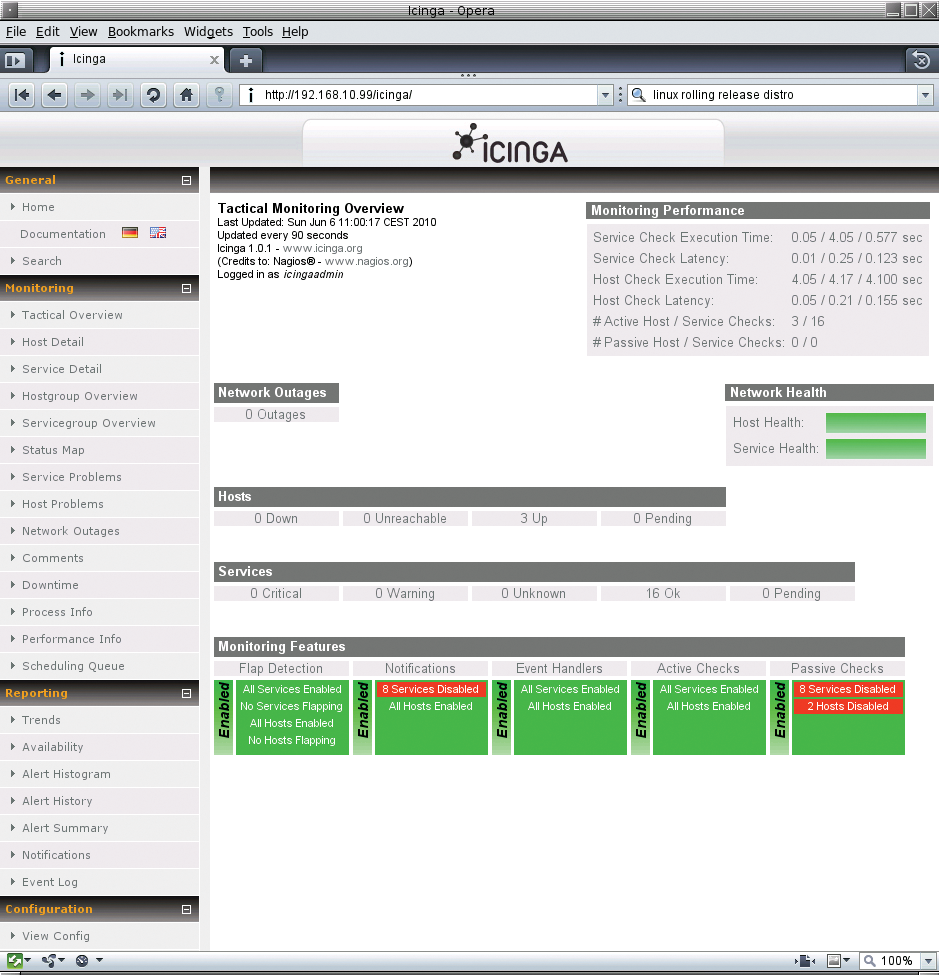
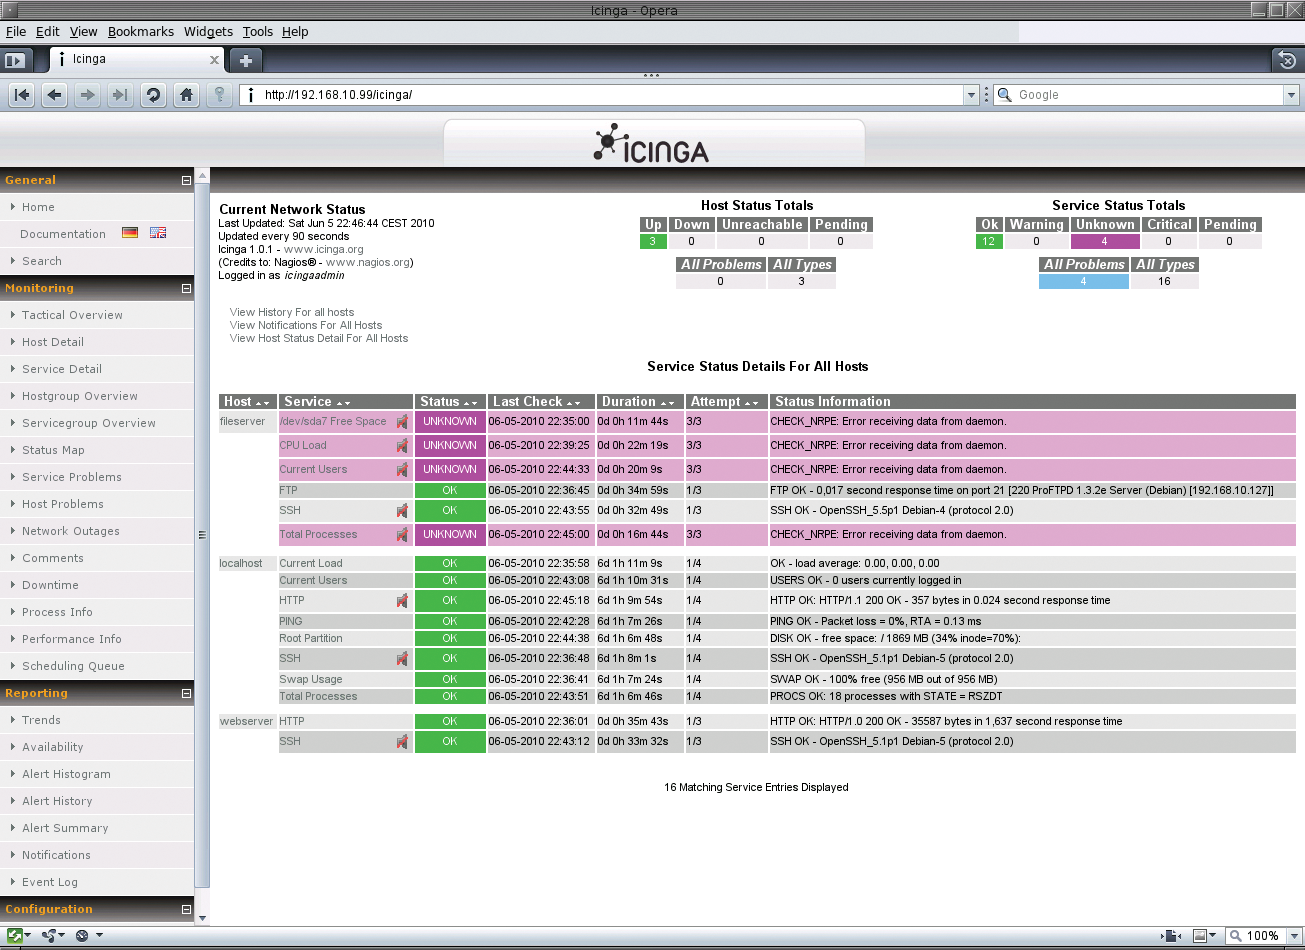
If everything is working, you'll see a lot of green in the user interface (Figure 1), but if something goes wrong somewhere, the color will change and move closer and closer to red to reflect the status of the hosts or services (Figures 2 and 3). Status messages are typically linked, so that clicking one takes you to more detailed information.
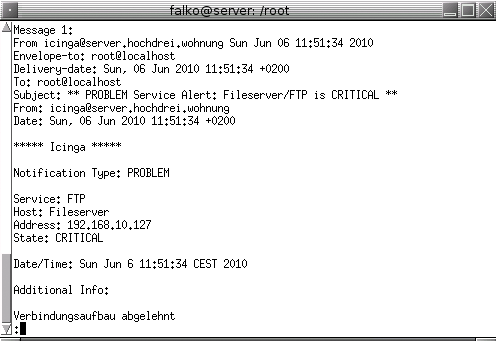
If something is so drastically wrong that a message is necessary, Icinga will check its complex ruleset to see whether it should send a message and, if so, to whom (Figure 4). The filters through which the message passes check the following: whether notifications are required, if the problem occurred at a time when the host and service should be running, if messages should be sent for this service in the current time slot, and what the contacts linked to the service actually want. Each contact can define its own rules to stipulate when it wants to receive messages and for what status. If multiple administrators exist and belong to a single group, Icinga will notify all of them. Again, you can define individual notification periods so that each admin will be responsible for one period.
Interesting Features
Icinga contains several interesting features that allow administrators to customize the network monitor to reflect their needs and system environment. For example, you can define distributed monitoring environments. If you need to monitor several hundred or thousand hosts, the Icinga server might conceivably run out of resources because every active check requires system resources. To take some of the load off the main server, Icinga can delegate individual tasks to auxiliary servers which, in turn, forward the results to a central server. Scheduling the checks can also help reduce this load. Instead of running all your active checks in parallel, you can let Icinga stagger them.
Another interesting feature is the ability to escalate notifications. Not every administrator can be available and ready for action 24/7. If the contact that Icinga notifies does not respond within a defined period, Icinga can attempt to establish contact on another channel (e.g., a cell phone instead of email). If this notification fails as well, the case can be escalated to someone higher up the chain of responsibility – the team leader, for example.
Conclusions
Icinga is a complex tool that provides valuable services whenever an administrator needs to monitor computers on a network. But don't expect to be able to set up the network monitor in a couple of minutes of spare time; if all goes well, the installation and configuration will take at least a couple of hours. Once you have battled through the extensive configuration, you can reward yourself with an extended lunch break: If something happens that requires your attention, Icinga will tell you all about it.
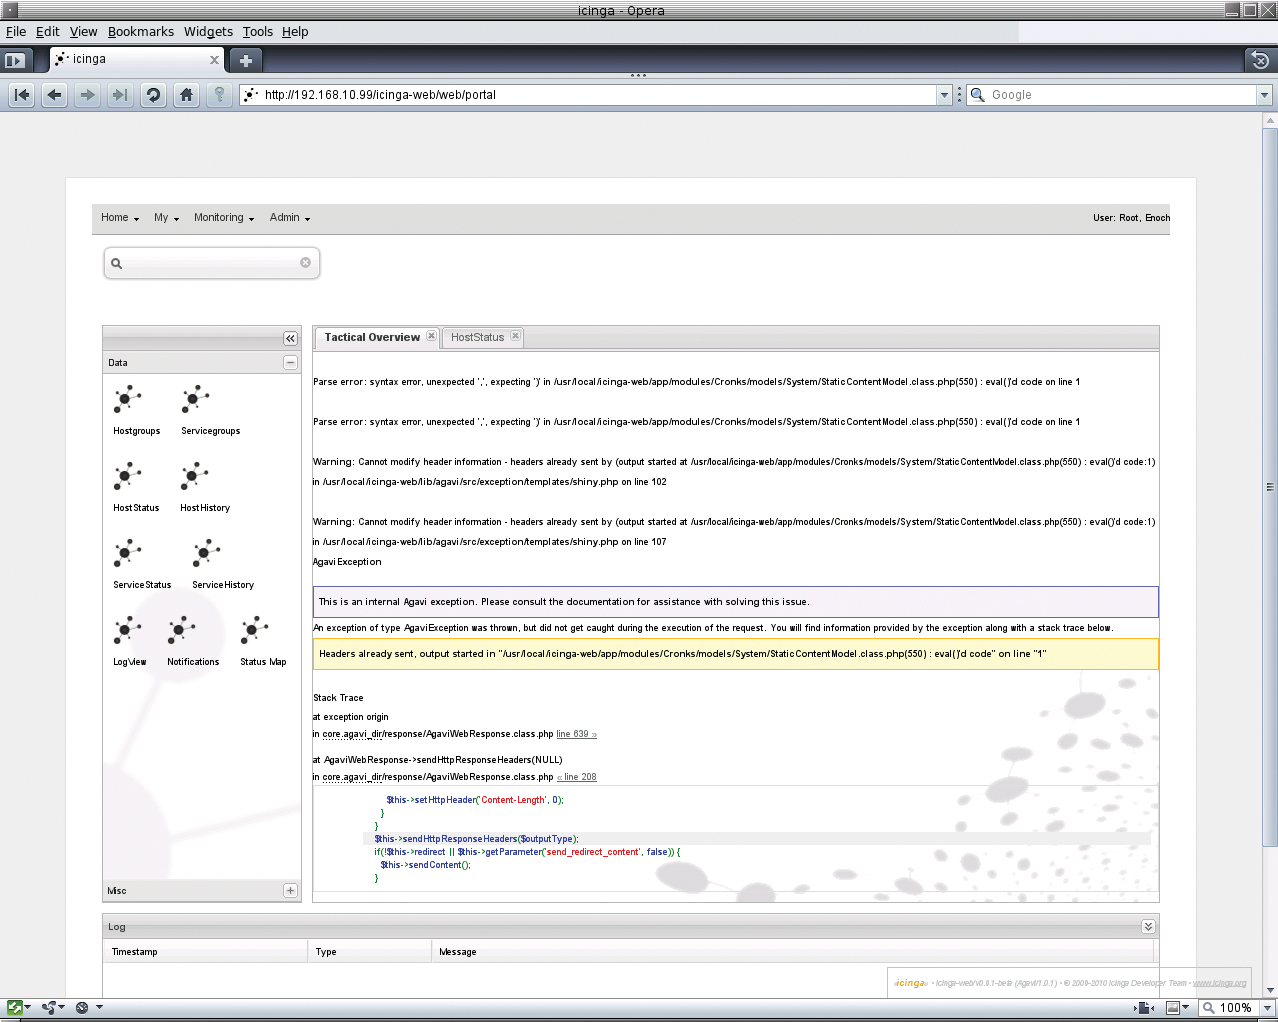
The traditional web interface is clear cut and packed with information; when this article went to print, however, the new interface wasn't entirely convincing (Figure 5). The installation was tricky, the documentation required some imagination at times, and the final results were disappointing. The interface was buggy and very slow under my, admittedly, not very powerful Icinga test server (Via C3, 800MHz, 256MB RAM). As a default, you need a new username and password for Icinga Web. That said, however, the current status does reveal some potential; it makes sense to check how the new interface is developing from time to time.
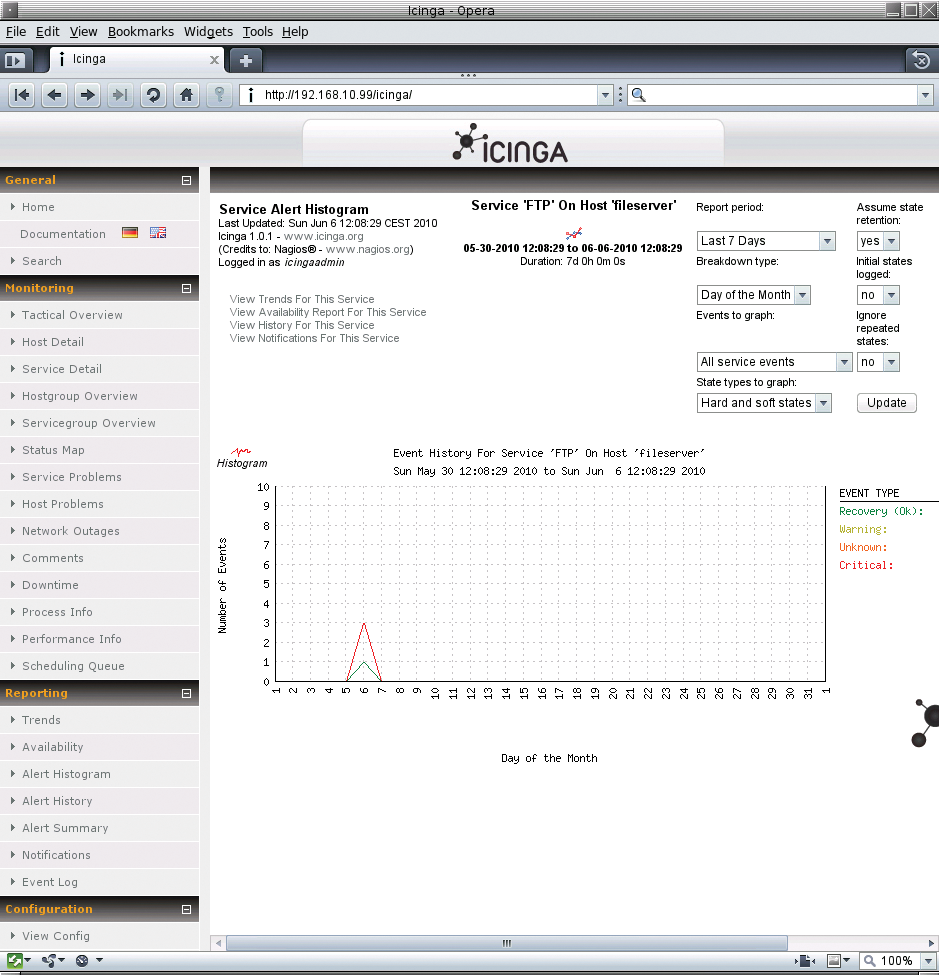
The Icinga kernel is well and comprehensively documented and leaves no questions unanswered. Icinga also offers a plethora of useful gadgets, such as the status map (Figure 6) or the alert histogram (Figure 7), making the job of monitoring hosts less boring – at least initially. The depth of information that Icinga provides is impressive and promises an escape route for avoiding calls from end users. In short, Icinga is a useful tool that makes the administrator's life more pleasant.
