
Forensic analysis with Redline and Volatility
Caught in the Act
In a previous article [1], I described how to obtain a memory image from a Windows computer that would allow forensic analysis. I briefly discussed using F-Response TACTICAL [2] to get the memory image, and then Volatility [3] and Mandiant Redline [4] for further investigation. In this paper, I dive more deeply into Redline and Volatility.
To begin, I review a raw memory dump of a known malware variant (see the "Malware Image" box) with Mandiant Redline. After firing up Redline, I chose By Analyzing a Saved Memory File under Analyze Data and browsed to the location of the memory image. Next, I edited my script to include Strings for both Process Listing and Driver Enumeration. Finally, I chose a destination to store the output for future analysis and to analyze memory dumps.
Redline
As I explained in the previous article, I took two different memory dumps from a Windows XP system: one after I executed the malware infection, and another after I rebooted the system. In comparing the two images, I noticed some differences. Remember, malware usually tries to hide in plain sight, attempting to appear legitimate, or uses rootkit techniques to hide from the view of normal analysis tools.
After installing the malware and completing a reboot, Redline revealed three process names (jh, process ID PID 38533; svchost.exe, PID 1560; and WScript.exe, PID 1744). Process jh (PID 38533) was spawned by a parent process – Not Available (528) – with a start time of 1601-01-01 00:00:00Z (Figure 1). Double-clicking on the Process name (jh) provides access to the detailed view.
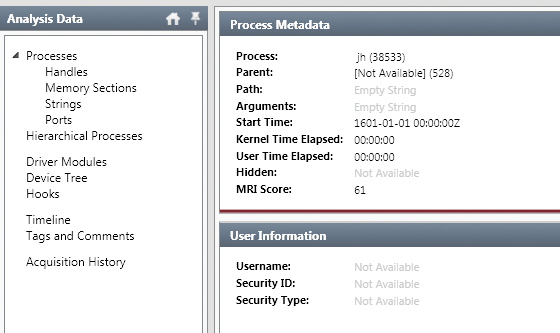
Choosing Hierarchical Processes in the Analysis Data panel showed that svchost.exe (PID 1560) was spawned by WScript.exe (PID 1744). Hierarchical Processes lists running processes in a tree format, showing which processes started other processes (Figure 2). If you take a look at the Process Metadata for jh in Figure 1, you'll see that it has an MRI Score of 61, as does svchost.exe (Figure 2, second column).

The Malware Risk Index (MRI) score, which is accessed by double-clicking a process-related item to see its detailed view and selecting the MRI Report tab at the bottom of the window, ranges from 0 (less risky) to 100 (more risky). Because these two processes started after the malware installed, they are likely bad. When I compared the Start Time of svchost.exe (PID 1560) with other svchost processes (Figure 3), I saw that it appeared to have started about 30 minutes after the other svchost processes.

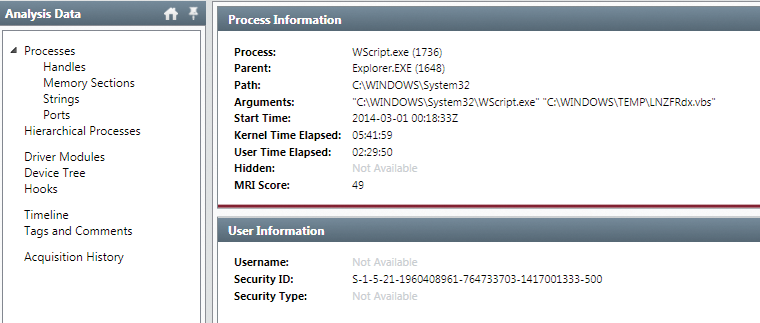
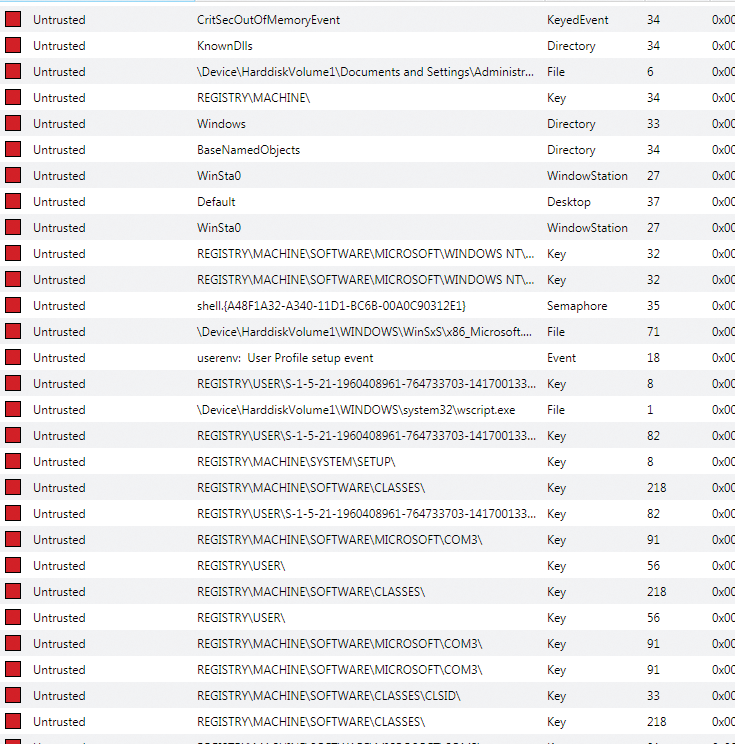
The parent process of svchost.exe (PID 3028) is WScript.exe (PID 1736); this is discovered by looking at Hierarchical Processes. After clicking on WScript.exe (1736), I discovered the user account that was logged on when the process was spawned and the full path of the process binary (Figure 4). Next, I clicked on the Handles tab located below and viewed the Handle Names; notice the Untrusted status in Figure 5. Using Redline to check for signed code may reveal suspicious executables.
To look for evidence of code injection, I chose Processes | Memory Sections located in the Analysis Data pane. This choice brings up memory pages for every process, although the particular malware I was investigating contained no injected memory sections that Redline could find.
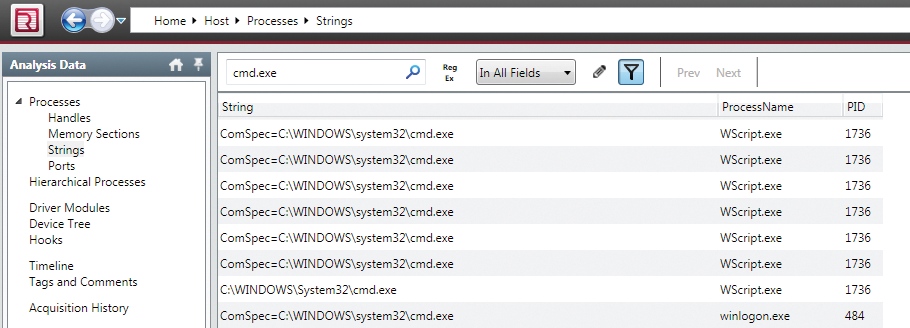
Finally, I used Process | Strings to look for additional evidence by entering http://, https://, .exe, and the like. In Figure 6, I'm searching for any cmd.exe run by WScript.exe. Other interesting strings to enter in the search box would be common Windows system and network commands, such as finger, net use, netstat, and so on.
Understanding normal activity is key when you start looking for badness. If you don't know what normal traffic activity looks like, you will be lost when trying to find said malware. One way is to better understand the operating system you are analyzing – in this case, Windows.
Understanding Windows process structure helps; for example, csrss.exe is created by an instance of smss.exe and will have two or more running instances. The start time is within seconds of boot time for the first two instances (Sessions 0 and 1). Start times for additional instances occur as new sessions are created, although often only Sessions 0 and 1 are created. (This information is available on the SANS DFIR poster [8].) Looking at Hierarchical Processes in Redline will reveal an instance of smss.exe that spawns csrss.exe.
Another interesting item to research is svchost.exe, which is used to run service DLLs and whose parent process, services.exe. Windows will run multiple instances of svchost.exe, each using a unique -k parameter for grouping similar services.
Malware authors often take advantage of the ubiquitous nature of svchost.exe and use it either directly, by installing the malware as a service in a legitimate instance of svchost.exe, or indirectly, by trying to blend in with legitimate instances, either by slightly misspelling the name (e.g., scvhost.exe) or by spelling it correctly but placing it in a directory other than System32.
On a default installations of Windows 7, all service executables and all service DLLs are signed by Microsoft. This information is also available on the SANS DFIR poster and would be very helpful to review.
After reviewing this memory image with Mandiant Redline, I found no smoking gun that definitively pointed to malware, so now I will look at an open source tool called Volatility.
Volatility
To begin, I go to the workstation that took the image off the Windows machine with the F-Response tool and open a terminal. After changing to the case files directory, I enter
$ python vol.py -f remote-system-memory11.img imageinfo
to get information about the image with imageinfo (Figure 7). The Suggested Profile(s) line in the output suggests parameters I can pass in to Volatility (with --profile=PROFILE); you may see more than one profile suggestion if profiles are closely related. I can figure out which one is most appropriate by checking the Image Type field, which is blank for Service Pack 0 and filled in for other Service Packs. To find the processes and DLLs, use
$ vol.py --profile=PROFILE -f FILE.img FORM
where PROFILE is one of the suggested profiles from the imageinfo output (here I'll use WinXPSP2x86), FILE is the memory image of interest (in this case, remote-system-memory11.img), and PROC takes on the values in Table 1; that is:
$ vol.py --profile=WinXPSP2x86 -f remote-system-memory11.img PROC
When using dlllist, look for strange DLLs that have been injected into legitimate processes and DLLs with suspicious-looking names. When used alone, this command produces a lot of output, so you can narrow down your search to a specific process with -p and the process ID, as in the last example of Table 1.
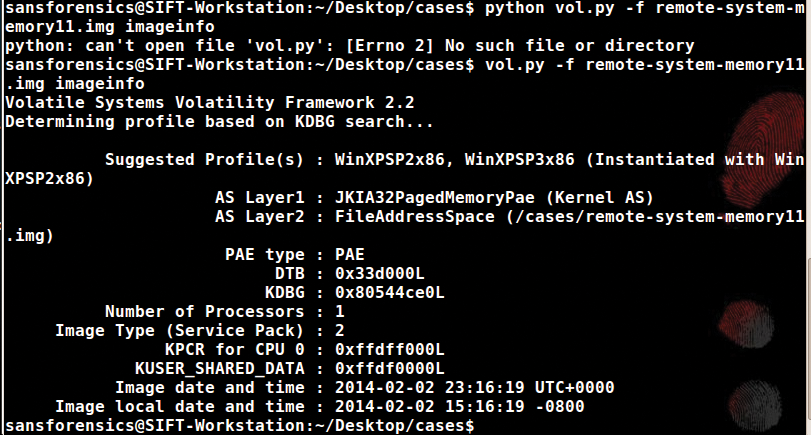
Tabelle 1: Process Information Options
|
PROC |
Output |
|---|---|
|
|
Lists the processes of a system. It does not detect hidden or unlinked processes. |
|
|
Views the process listing in tree form. Child processes are indicated using indentation and periods (Figure 8). |
|
|
Enumerates processes using pool tag scanning. This can find a process that previously terminated (inactive) and processes that have been hidden or unlinked by a rootkit (Figure 9). |
|
|
Displays process-loaded DLLs and shows the command line used to start the process (including services) along with the DLL libraries for the process. |
|
|
Displays process-loaded DLLs for PID 1764 |

pstree example. Notice the child processes indicated by indentation and periods.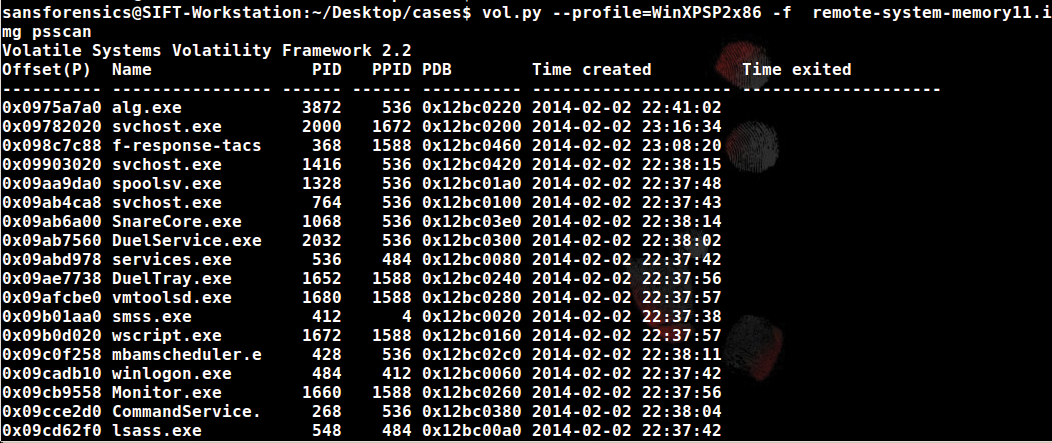
psscan can find hidden processes.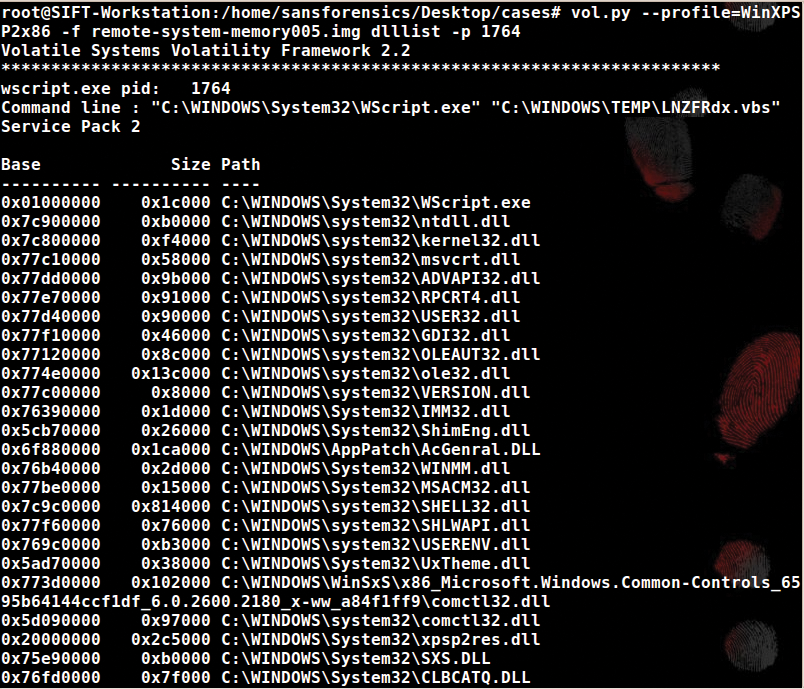
dlllist to display DLLs for the process WScript.exe.Volatility has many features organized by plugins and categories. These categories include image identification, processes and DLLs, process memory, kernel memory and objects, registry, crash dumps, hibernation, malware/rootkits, and networking, which I look at next.
Volatility Network Resources
To view active connections, use the connections command, or to find connection structures using pool tag scanning, use the connscan command:
$ vol.py --profile=WinXPSP2x86 -f remote-system-memory005.img connscan
Pool scanning is a technique used when a piece of memory is allocated in Windows with a special tag that corresponds to the driver or subsystem that allocates the memory. Often, you can find previous connections that have since been terminated. The connscan command only works with Windows XP and Windows 2003 Server.
In Figure 11, notice the two connections to 10.10.3.180. What would be trying to communicate on the network from the Windows XP box to an internal 10.10.3.180? I don't have anything with that IP address on this network, so I need to investigate PIDs 1792 and 132 further. Running psscan to enumerate processes does not show PID 1792, so that is a dead process; however, PID 132 shows up as svchost.exe. When I run pstree for more information, the indented list in Figure 12 shows parent and child processes.

connscan command.
svchost.exe is wscript.exe, which is a child of explorer.exe.Another plugin available in Volatility called malfind extracts injected DLLs, injected code, unpacker stubs, and API hook trampolines and scans for any ANSI string, Unicode string, regular expression, or byte sequence in processes or in kernel driver memory. The syntax for this plugin is
$ vol.py --profile=WinXPSP2x86 -f remote-system-memory005.img malfind-D memory/
which dumps all the processes with injected code in the directory called memory (Figure 13). The next step is to upload these .dmp files to VirusTotal to see if it can identify any known issues. The only suspect DMP file flagged by VirusTotal (Figure 14) was 0x370000.dmp, which is the F-Response tool used to extract the memory image. This is a false positive.

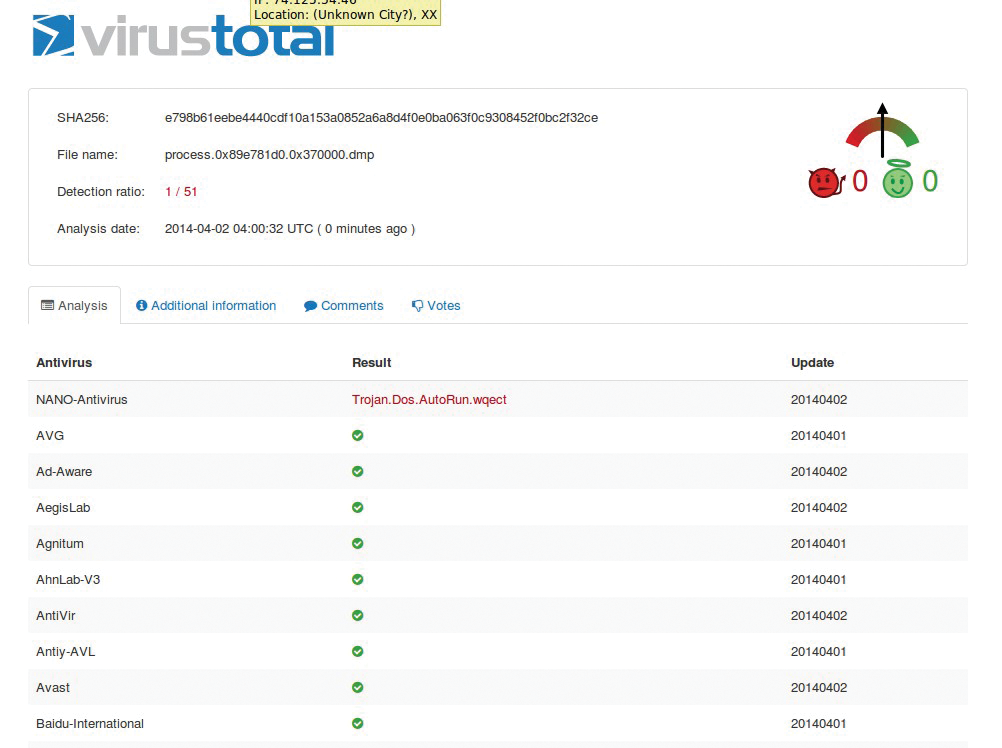
0x370000.dmp (F-Response file) generated by running malfind.Conclusion
After taking a class for GCFA certification [9] and learning how to use the tools described in this article, I started analyzing the malware found by the firewall on our network, along with a known malware variant from Palo Alto Networks. This example was a challenge to analyze because the investigation threw no obvious red flags, demonstrating how you need to dig deep to find threats to your systems. What I learned:
1. The memory image taken before infection showed communication with the Windows box and the forensic workstation, but no other connections.
2. The memory image taken after the infection showed communication with 10.10.3.180 (two instances), which is an internal IP address that does not exist on my test network.
3. The PIDs related to IP address 10.10.3.180 were 1792, a dead process, and 132, svchost.exe, which was a child of wscript.exe and had a parent process of PID 1648 (explorer.exe).
4. svchost.exe (PID 132) is a generic host process for Windows services and is used to run service DLLs; it should always be a child of services.exe. Because it showed up as a child process of wscript.exe, it was a clear indication of wrongdoing (Figure 12).
